

Deep Dive: Admiral - The Art of Getting Rich Slowly
Why Britain’s fast-growing and boring money machine could be the perfect antidote to the AI mania.

New to The Atomic Moat? This analysis of Admiral ($ADM) is a prime example of how we dissect high-quality compounders. If you want new deep dives sent to your inbox every Sunday, join 900+ other investors below.
Folks, I have a confession. I love boring companies, but sometimes I forget that I do.
I spent last week deep in the archives, reading about Shelby Cullom Davis for a content piece (that you can now find on Atomic Moat under “The Money Mind”).
For those who don’t know, Davis was the guy who turned $50,000 into nearly $900 million. He didn’t do it by chasing the “hot dot-coms” of the 1950s or the “Nifty Fifty” darlings. He did it by buying insurance stocks when they were unloved, misunderstood, and frankly; boring as dirt.
Then, I looked up from my desk and saw what’s happening in the market right now.
It feels like a frantic party where everyone is trying to squeeze through the same door marked 'AI & Space.' You have companies trading at 50x, 70x, even 100x earnings just because they uttered the magic words 'Generative AI' or 'Total Addressable Market.'
That got me thinking: What if the real money isn’t in the stars, but on the pavement?
I wanted to find the antidote to the hype. I wanted to see if there was a “Davis-style” compounder hiding in the absolute most boring sector I could find.
That led me to Admiral.
While everyone else is trying to figure out which semiconductor chip will rule the world in 2035, Admiral is doing something beautifully simple: figuring out how to insure a Vauxhall Corsa without losing money.
This isn’t about being a contrarian for the sake of it. It’s about asking a simple question: Is there solid, double-digit growth available in a sector that most people fall asleep analyzing?

Shelby Cullom Davis proved that you don’t need a rocket ship to get to the moon; sometimes you just need a disciplined insurer and a lot of patience.
Let’s dive in.
If You’re In a Rush (The 30-Second Elevator Pitch)
What they actually do: They sell UK insurance (mostly cars), dabble in “Beyond Motor” lines (like house insurance), and run a lending arm called Admiral Money that’s starting to actually move the needle.
Challenges: Insurance results are a “timing factory.” Between the insurance cycle, discounting rates, reserve development, and profit commissions, analysts spend all day arguing about what is “real profit” and what is just “accounting weather.”
What fixes it: Market price declines are finally slowing down, Admiral is staying disciplined (not chasing bad business), and the growth in non-motor and lending isn’t watering down the quality of the main business.
Atomic Position: Currently on my watchlist at the time of writing. I see a credible path to High Conviction here, but only if the underwriting and capital return engine stays boring. Boring is good.
The Setup: A scorecard that demands respect
Admiral’s H1 2025 is a strong print. It’s the kind of report that makes people forget just how cyclical and nasty the motor insurance game can be when it rains.
Let’s look at the hard numbers. No fluff, just the scorecard:
Group profit before tax was £521m .
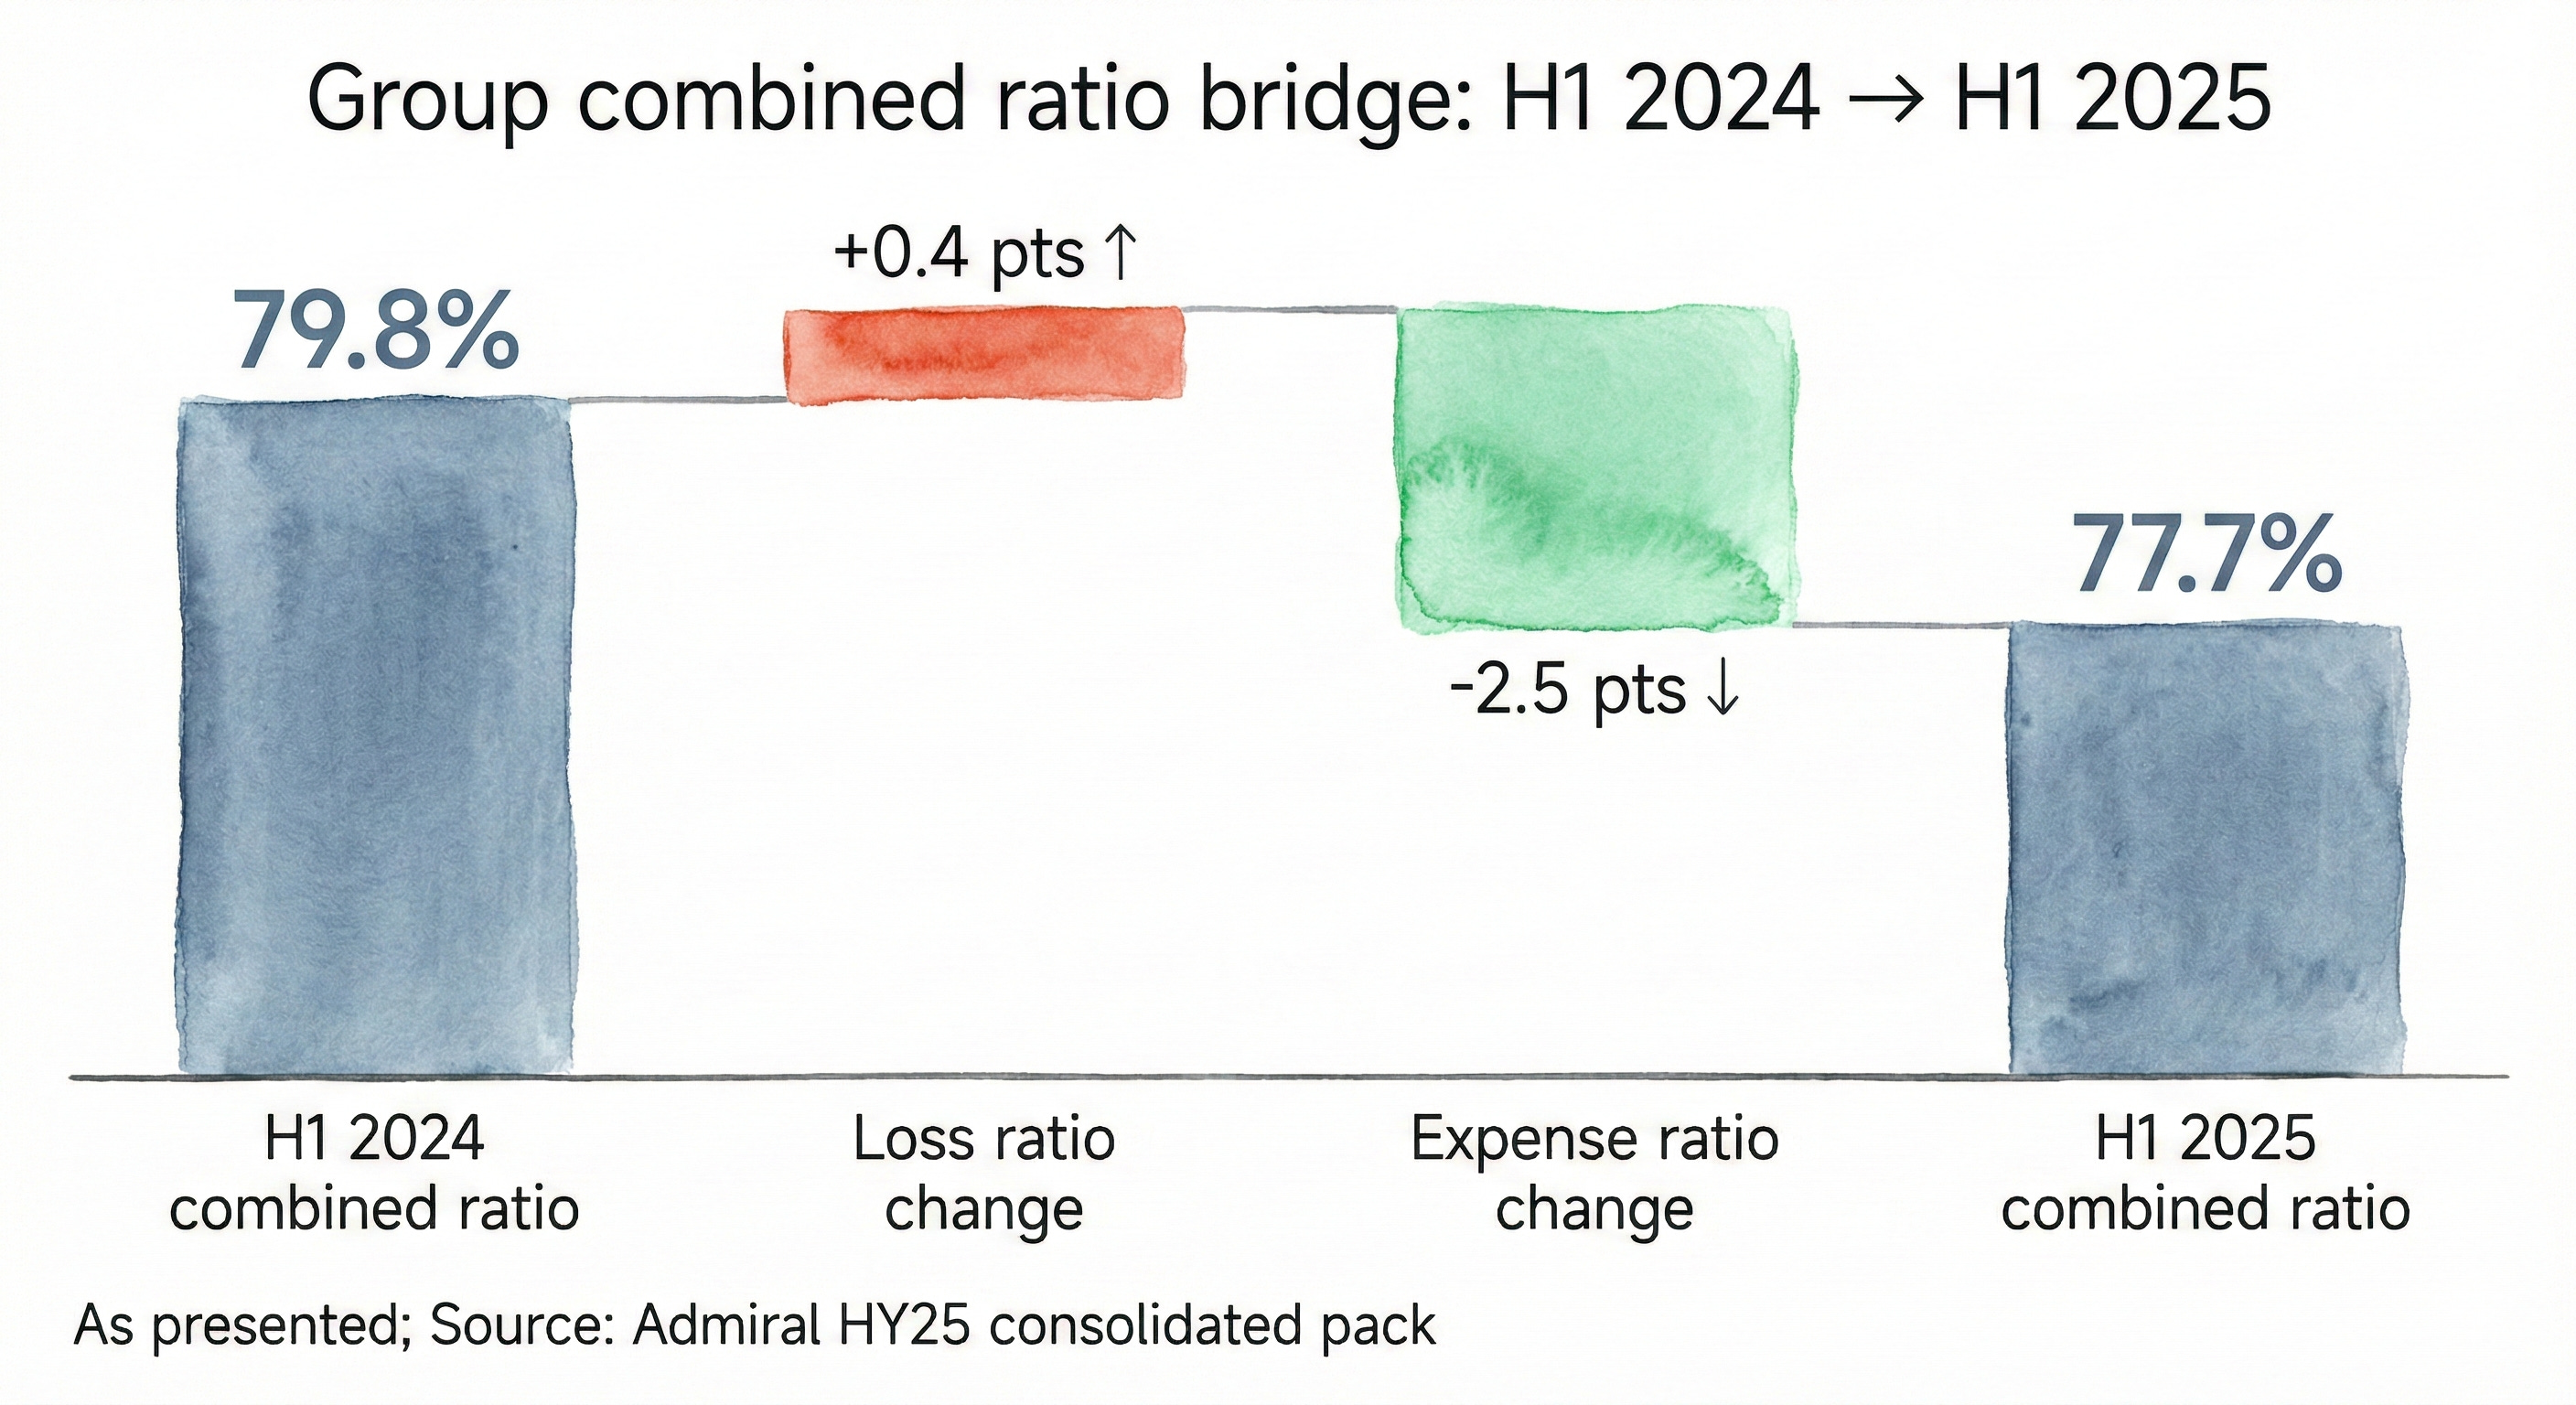
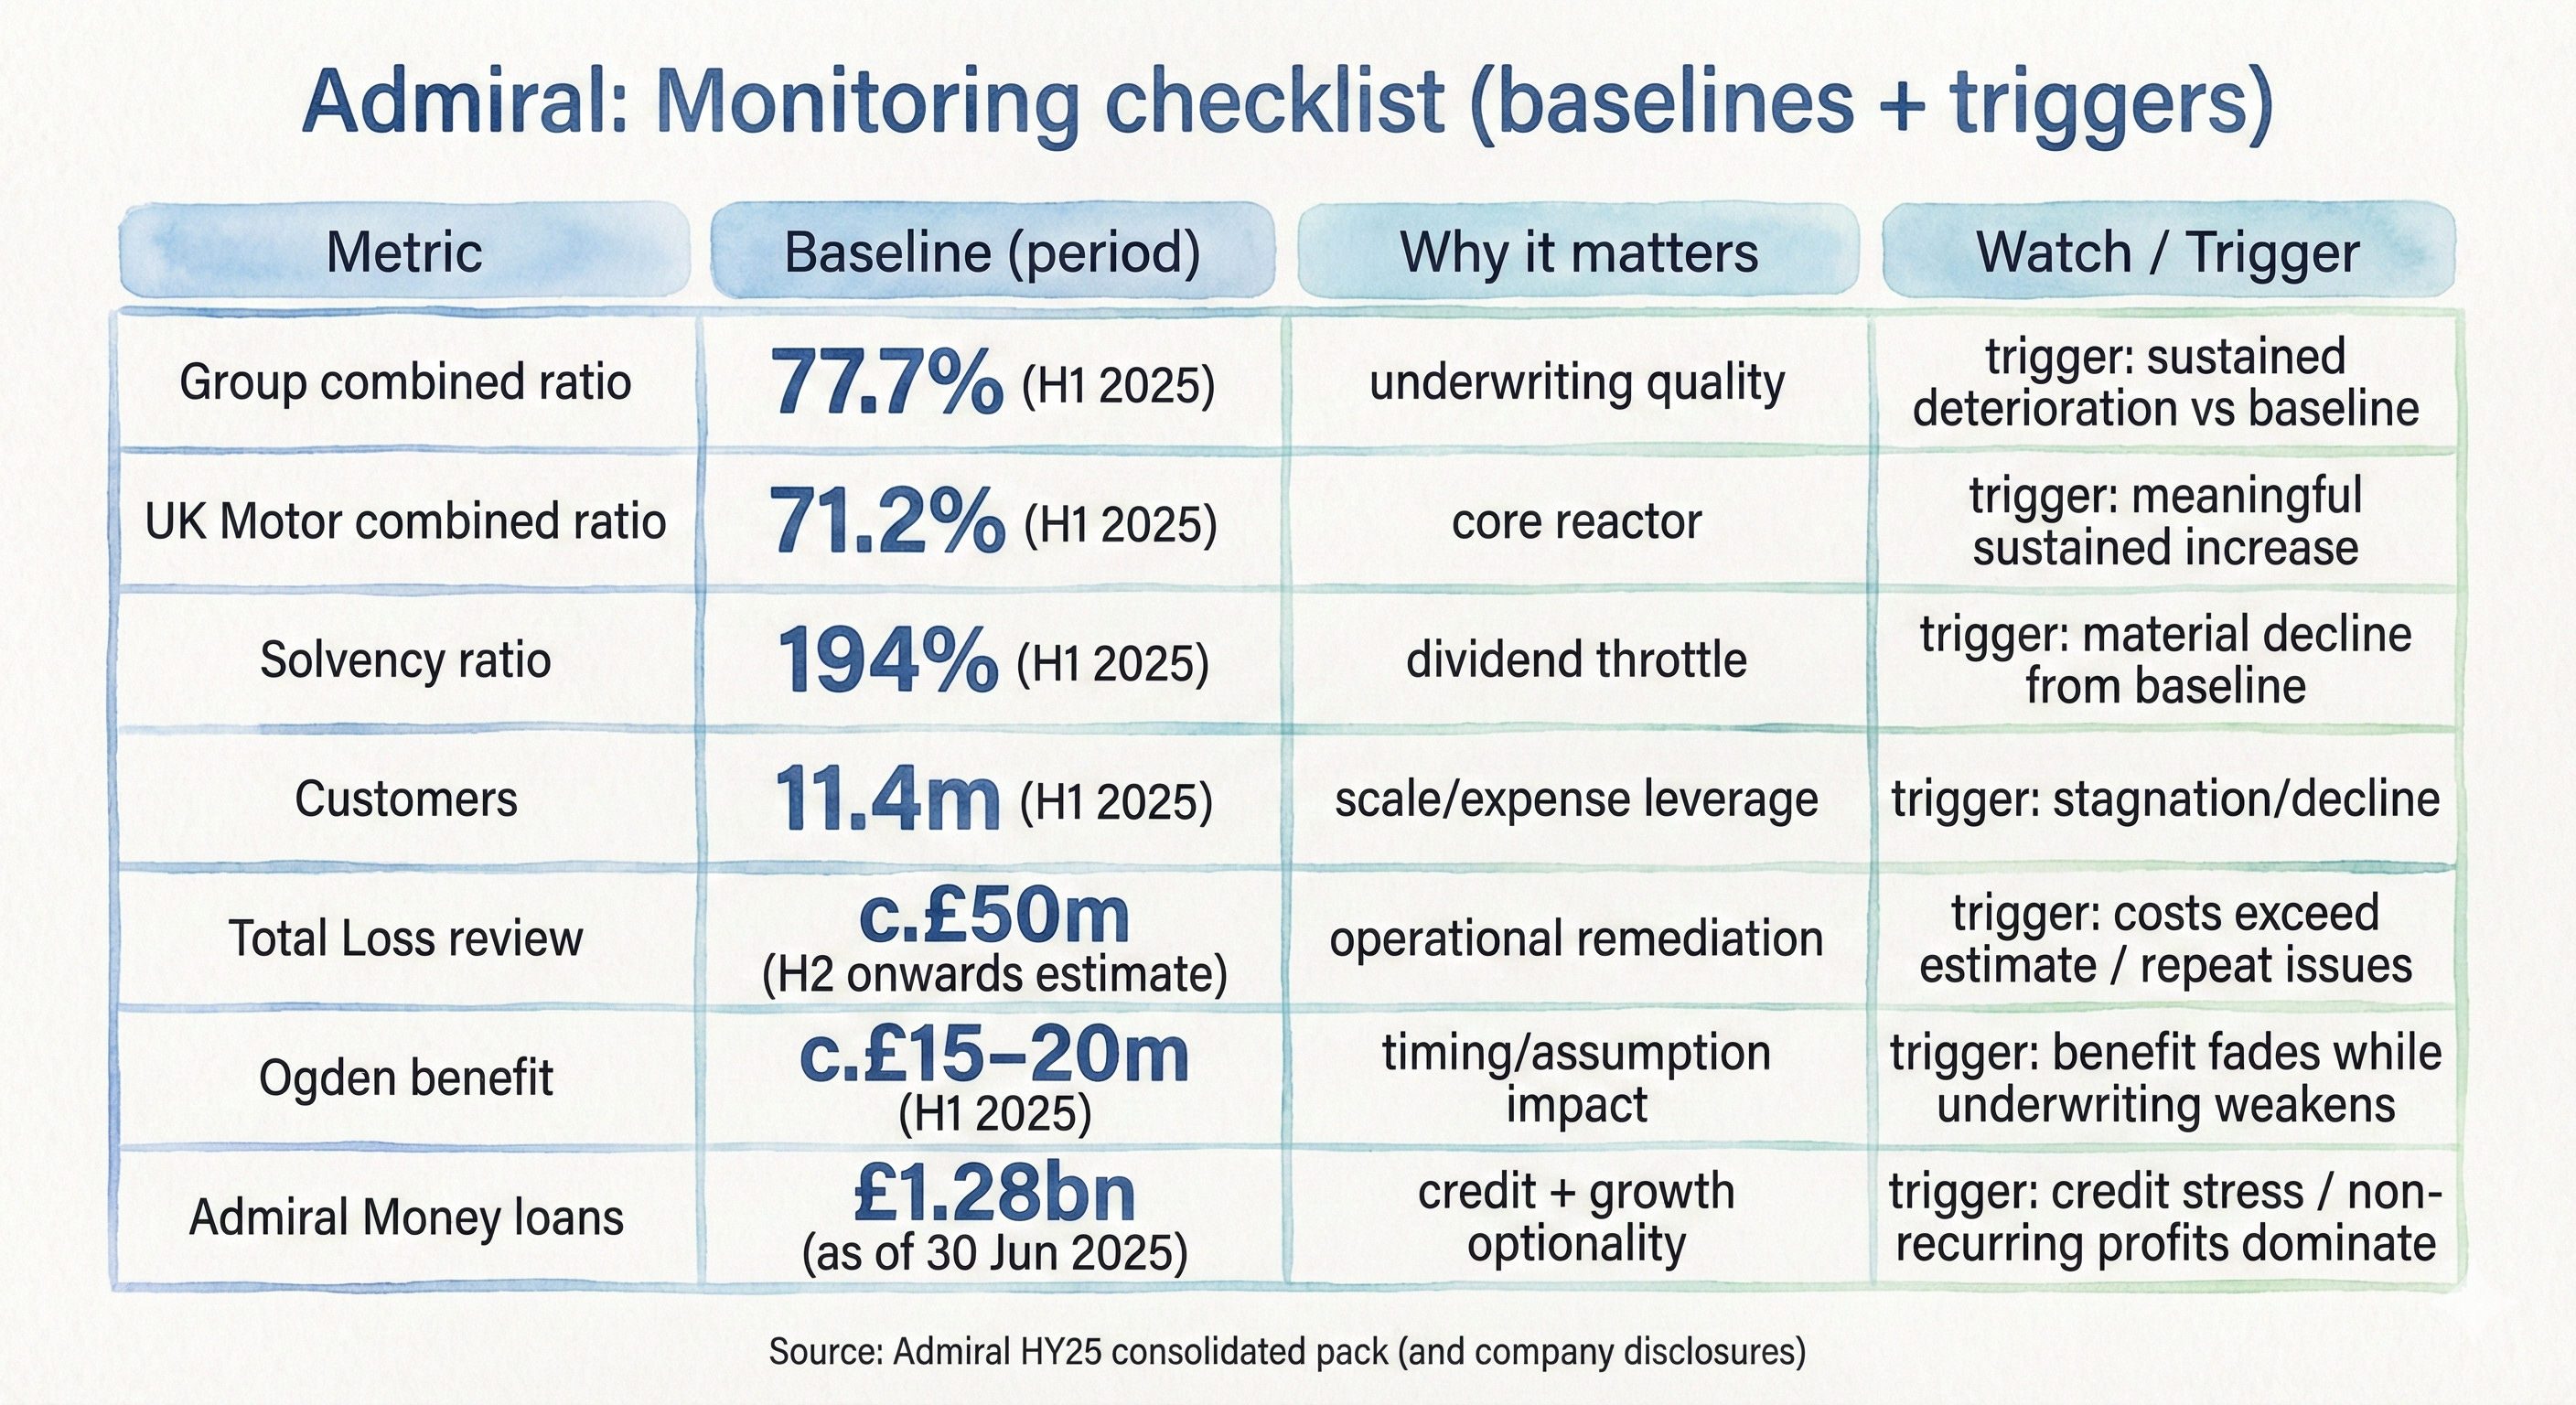
Group combined ratio was 77.7%. Editor’s Note: For those new to insurance, anything under 100% is profit. 77.7% is printing money.
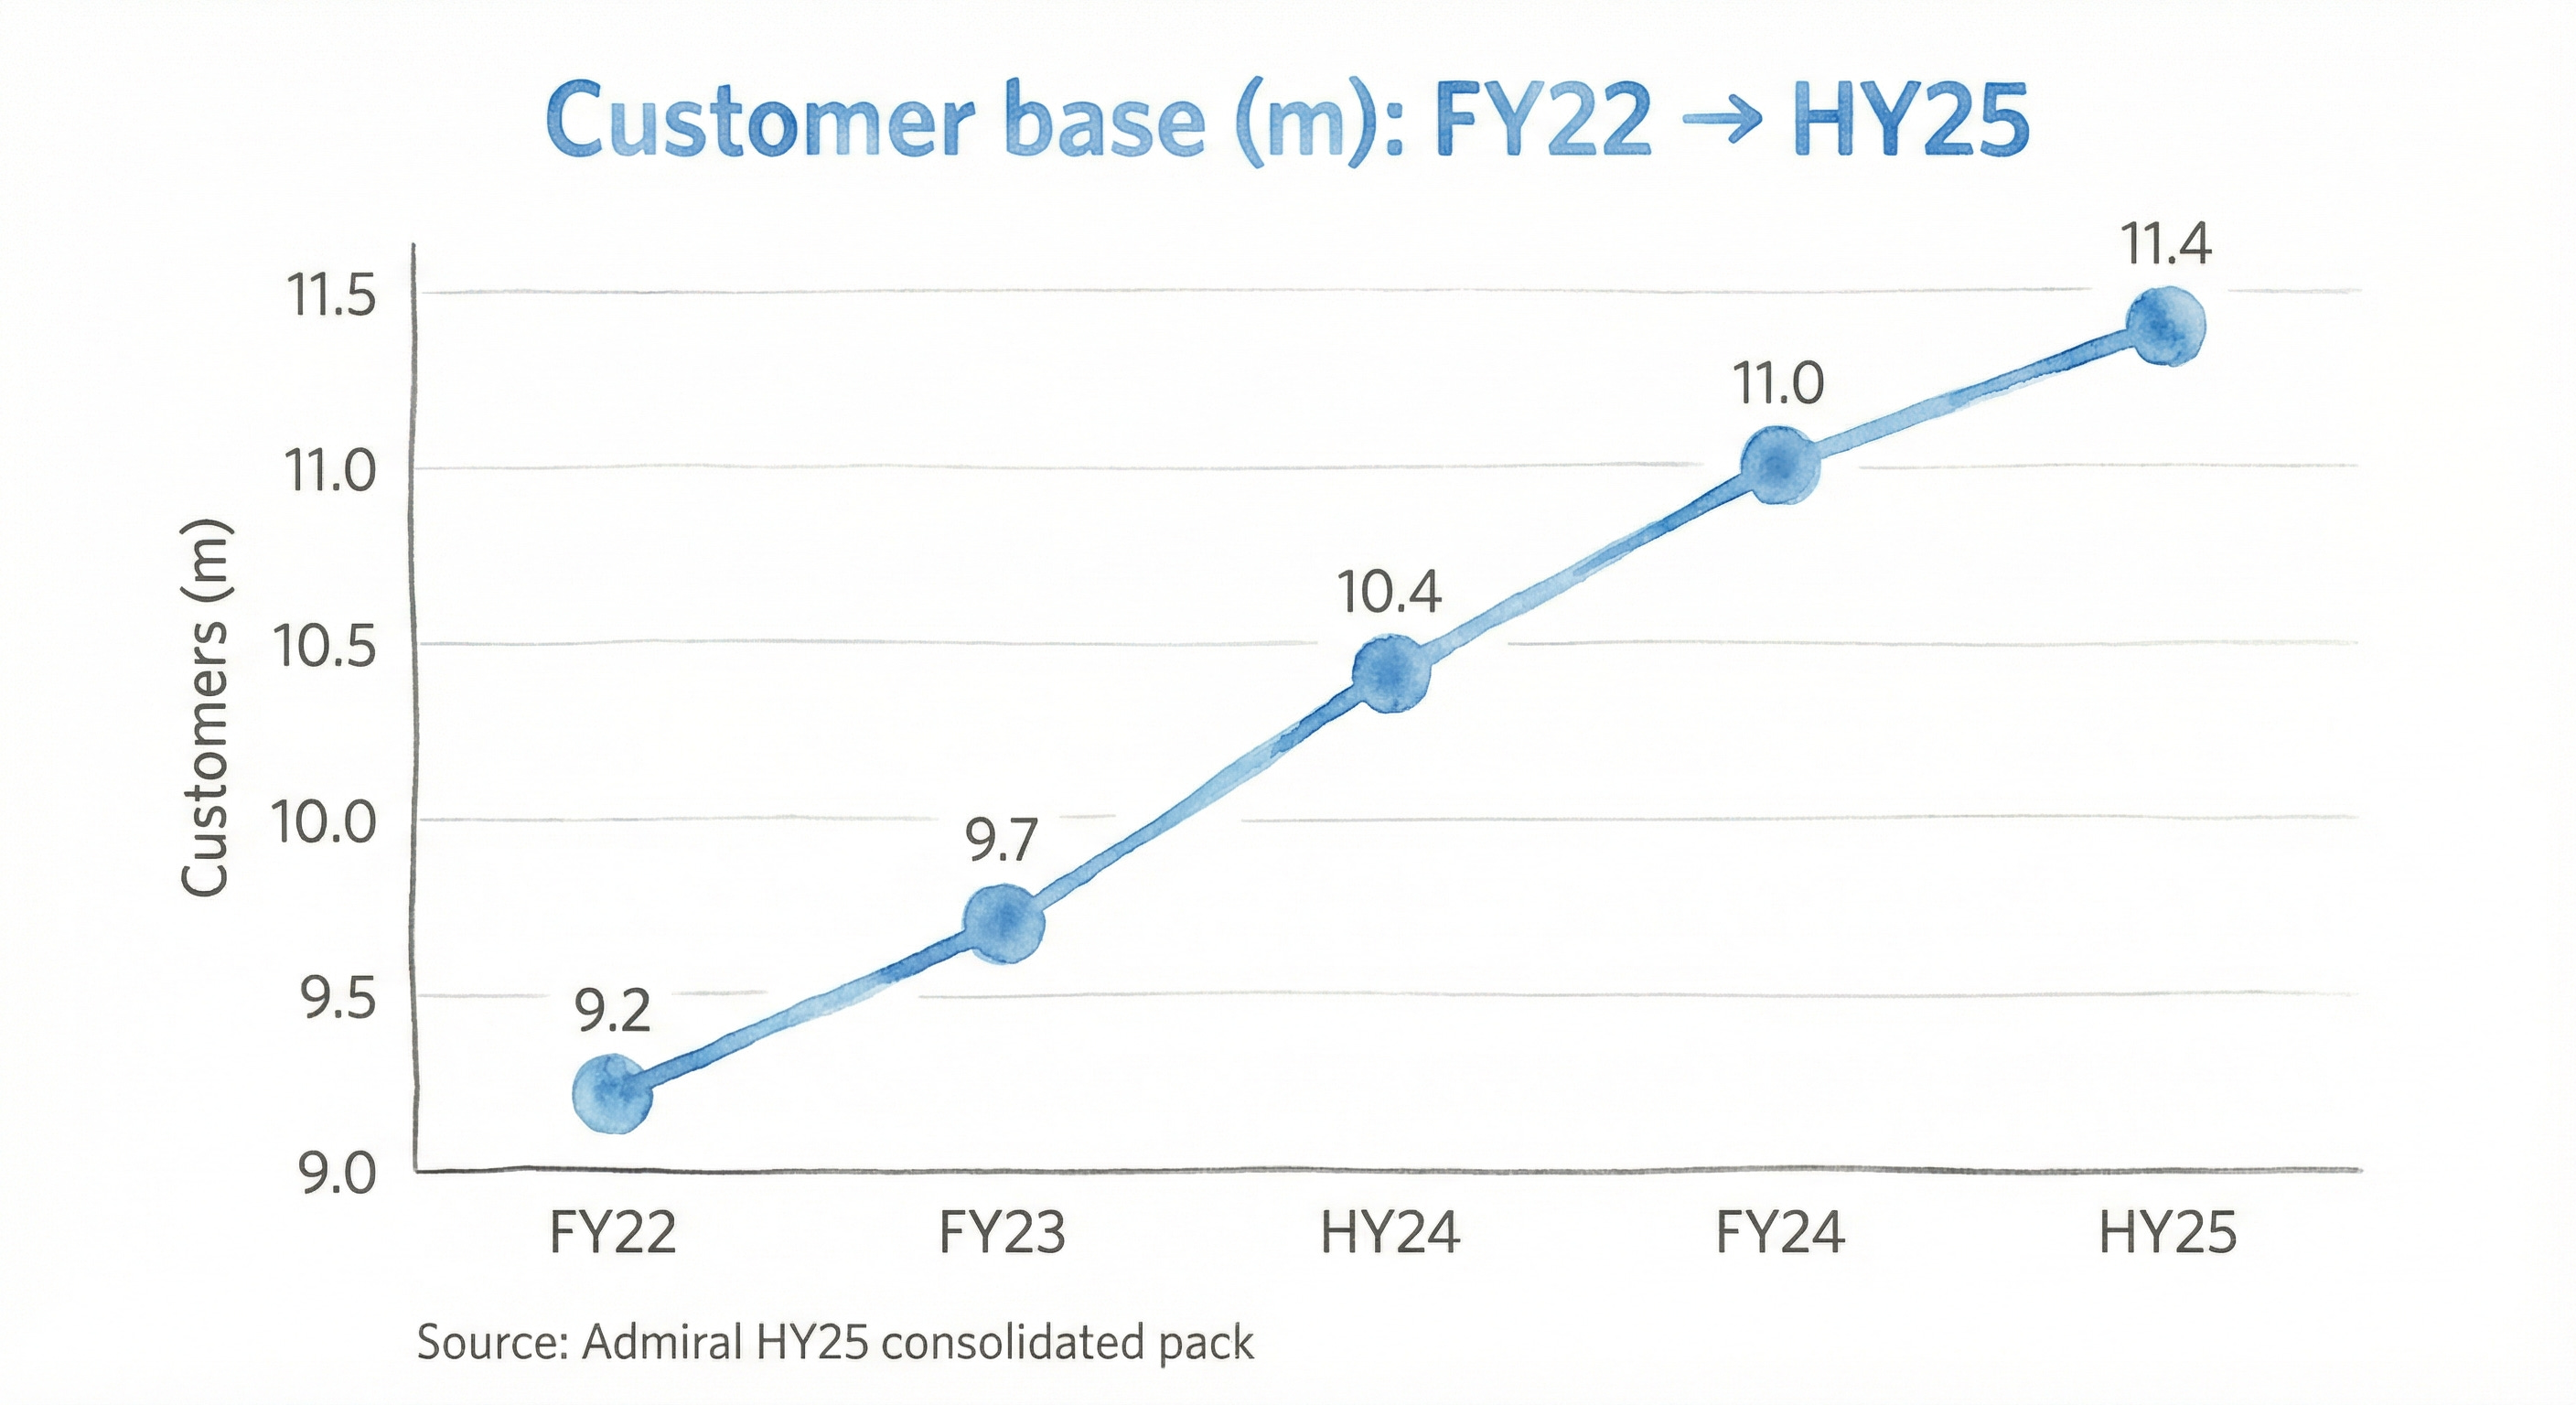
Group customers were 11.4m.
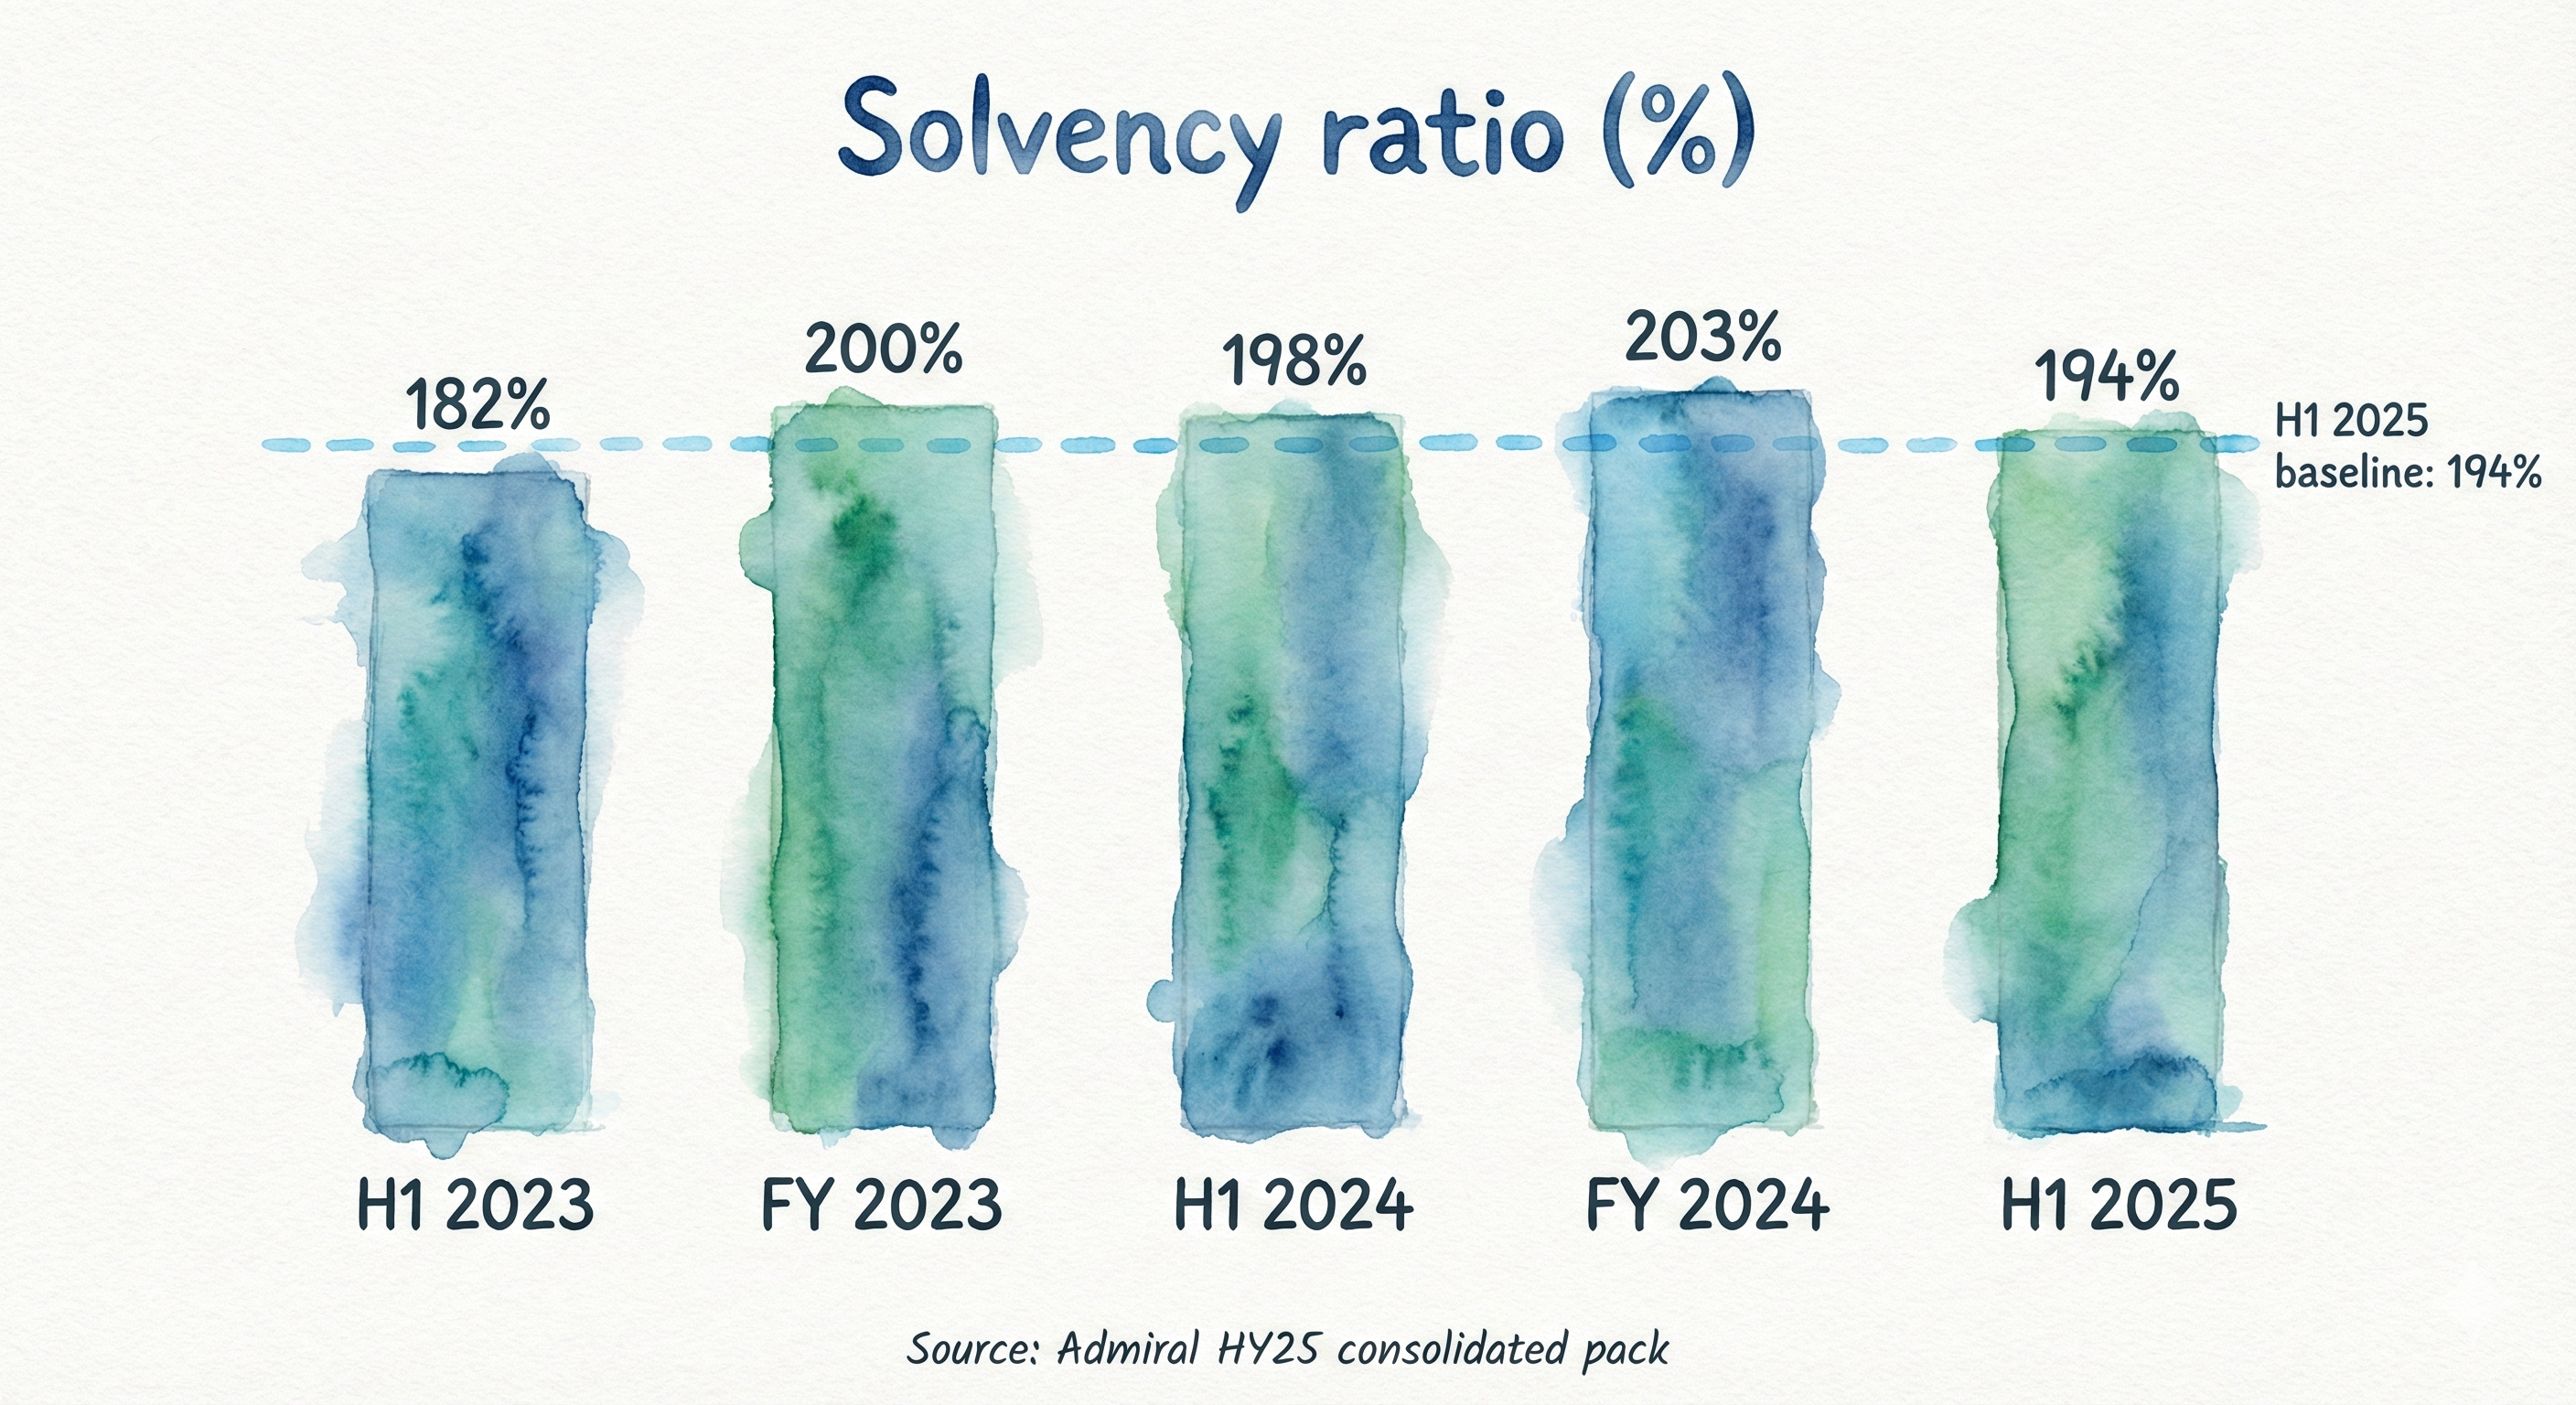
Solvency ratio was 194%. That’s a fortress balance sheet.
Interim dividend was 115.0p.
The Variant Perception: Stripping away the Theatre
Here is where the argument lives.
The Market Take: “It’s just an insurer. Enjoy the good half-year. But don’t you dare try to annualize these earnings like it’s a SaaS company. The rain is coming.”
The Bull Take: “You’re missing the point. This is a disciplined underwriting machine with unusually explicit capital return behaviour. They give the money back.”
The Bear Take: “The cycle is rolling over. Claims inflation and market price declines are going to eat the margin. All those ‘extras’—like assumption benefits and timing differences—are just flattering the headline number.”
This deep dive is about one thing: Is Admiral’s economic engine structural enough to stay attractive when pricing gets soft? Anyone can make money in a hard market. I want to know if they can swim when the tide goes out.
Atomic Take: Admiral looks like a genuine operator. But remember, the insurance cycle is still the radiation source—so you underwrite the dials, not the vibes.
Falsifier: If the Group combined ratio moves back above 79.8% (H1 2024, %, as presented) and stays there for two consecutive half-years, the thesis is in trouble.
How the Business Actually Makes Money
Admiral’s core trick is simple in concept and incredibly hard to pull off in the real world:
Price the risk better than the guy across the street.
Handle claims better than the guy across the street.
Keep costs tighter than a drum.
Use risk transfer (reinsurance) to turn that good underwriting into cash we can spend, without living on the edge of bankruptcy.
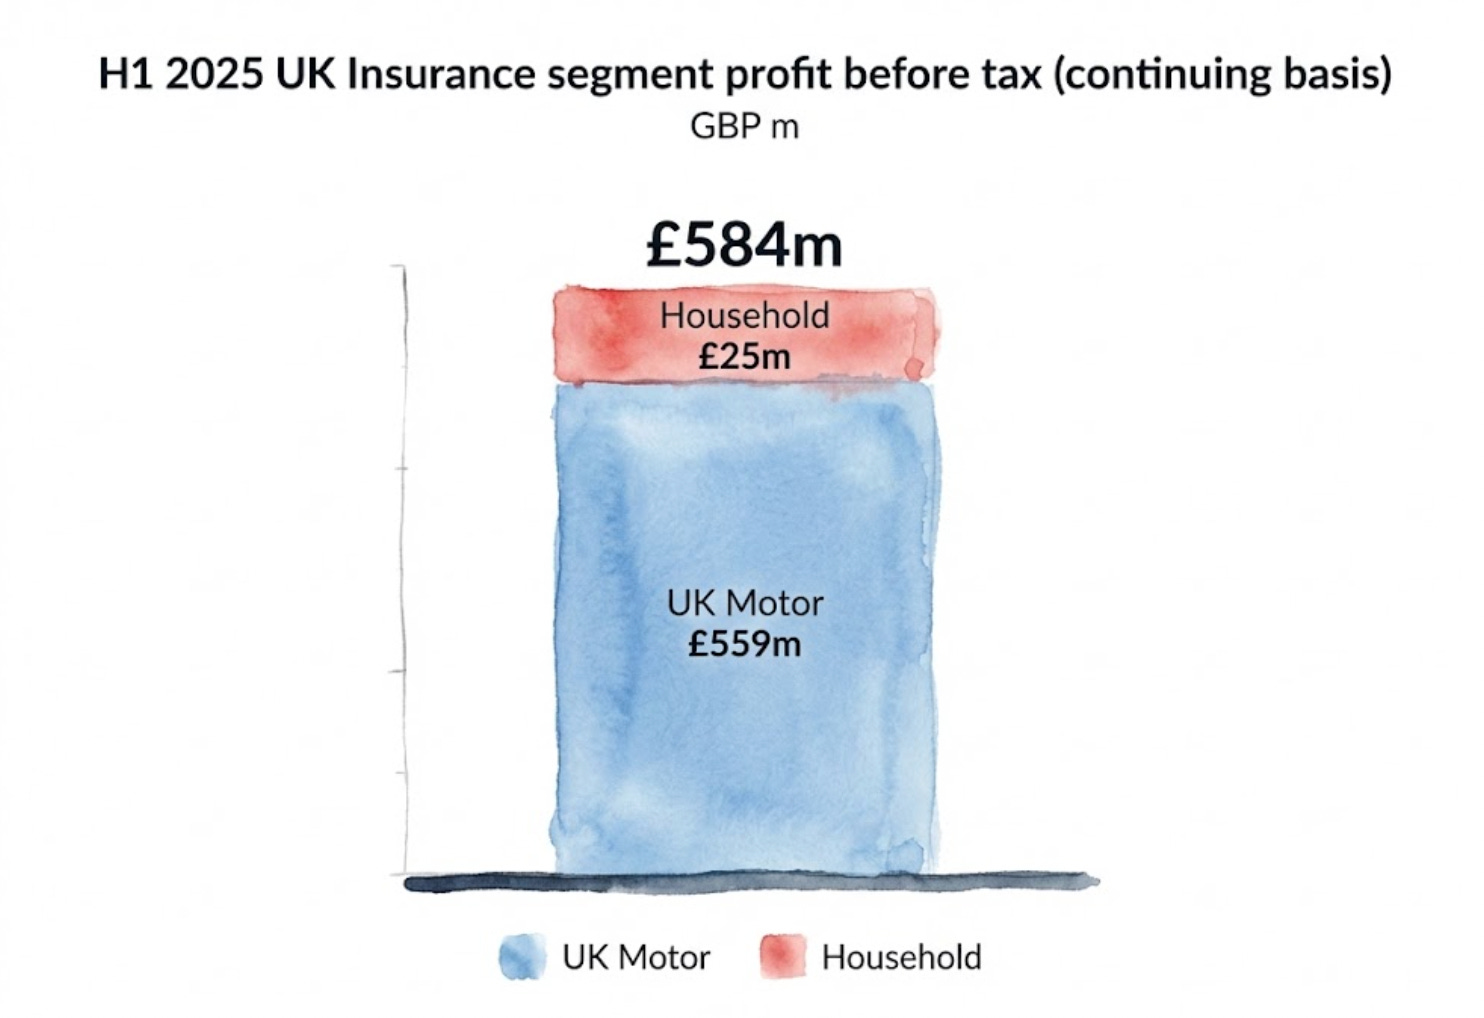
Don’t get distracted by the revenue story. Revenue is vanity; profit is sanity. Let’s look at where the cash actually comes from. On a continuing basis, segment profit before tax in H1 2025 was:
UK Insurance: £584m.
UK Motor: £559m. <-- This is the engine.
Household: £25m.
Admiral Money: £16m, importantly including £10m from the sale of back book loans.
Other Group items (including Pioneer): ( £43m ).
Translation: UK Motor is still the nuclear reactor powering this city. Everything else is either an amplifier, a hedge, or an expensive experiment that you’re hoping matures into something “strategic.”
(Household is currently the most convincing of the diversifiers because it’s already profitable in the period presented. That’s a good sign.)
Stop & Think: Why do insurers try to diversify into “Household” or “Lending”? Because cars are dangerous. But notice that after all these years, £559m still comes from cars and only £25m from houses. It’s hard to beat your core competency.
The Holy Trinity: Underwriting Quality
Underwriting quality is the central KPI because it forces honesty. You can’t fake these numbers for long. Admiral reports:
Group loss ratio: 57.4%
Group expense ratio: 20.3%
Group combined ratio: 77.7%
Why do I obsess over these ratios? Because they drive the entire narrative.
Underwriting profit funds the dividends. It supports the solvency. It buys time for “Beyond Motor” to scale up without the group turning into a balance-sheet gymnastics routine.
The Admiral Money Trap: Admiral Money is the optionality, and the optics trap. This business can absolutely be a value creator (there’s real net interest income and portfolio scale there), but look closely at H1 2025: the profit includes £10m from selling back book loans. The loan book is now £1.28bn on-balance sheet.
If you want a single “don’t get irradiated” rule for investing in insurers who lend money: Separate recurring economics from one-time portfolio actions. Then, watch the credit outcomes like a hawk as the book grows.
Don’t be Naïve
The easiest way to misread Admiral is to treat its reported profitability as a single clean line. It isn’t. Even when everything is “legit” and above board, insurance earnings are full of timing levers:
Profit commissions
Reserve development
Discount unwinds
Assumption impacts
The right question is not “is this pure?” It’s never pure. The question is: “Is the underlying underwriting behaviour strong enough that the timing levers don’t become a crutch?”
Atomic Take: Admiral’s moat is operating discipline (pricing + claims + cost) plus capital plumbing—but you only get paid if that discipline survives softer pricing.
Falsifier: Watch out if the UK Motor combined ratio deteriorates meaningfully from 71.2% (H1 2025, %, as presented) and stays worse for two consecutive half-years.
What Went Wrong (The “Oops” Files)
Admiral’s “went wrong” story isn’t a scandal. It’s the normal arc of the insurance story: Pricing peaks, competition comes back, claims costs creep up, and suddenly every operational weakness you didn’t know you had becomes a slide deck in the boardroom.
The market data management highlights are clear: Prices are still down year-on-year, but the rate of decline is slowing.
In Q2 2025, ABI average paid premium was £562 (GBP), down 10% YoY and down 3% versus Q1.
Confused new business quote was £755 (GBP), down 14% YoY but only down 1% versus Q1.
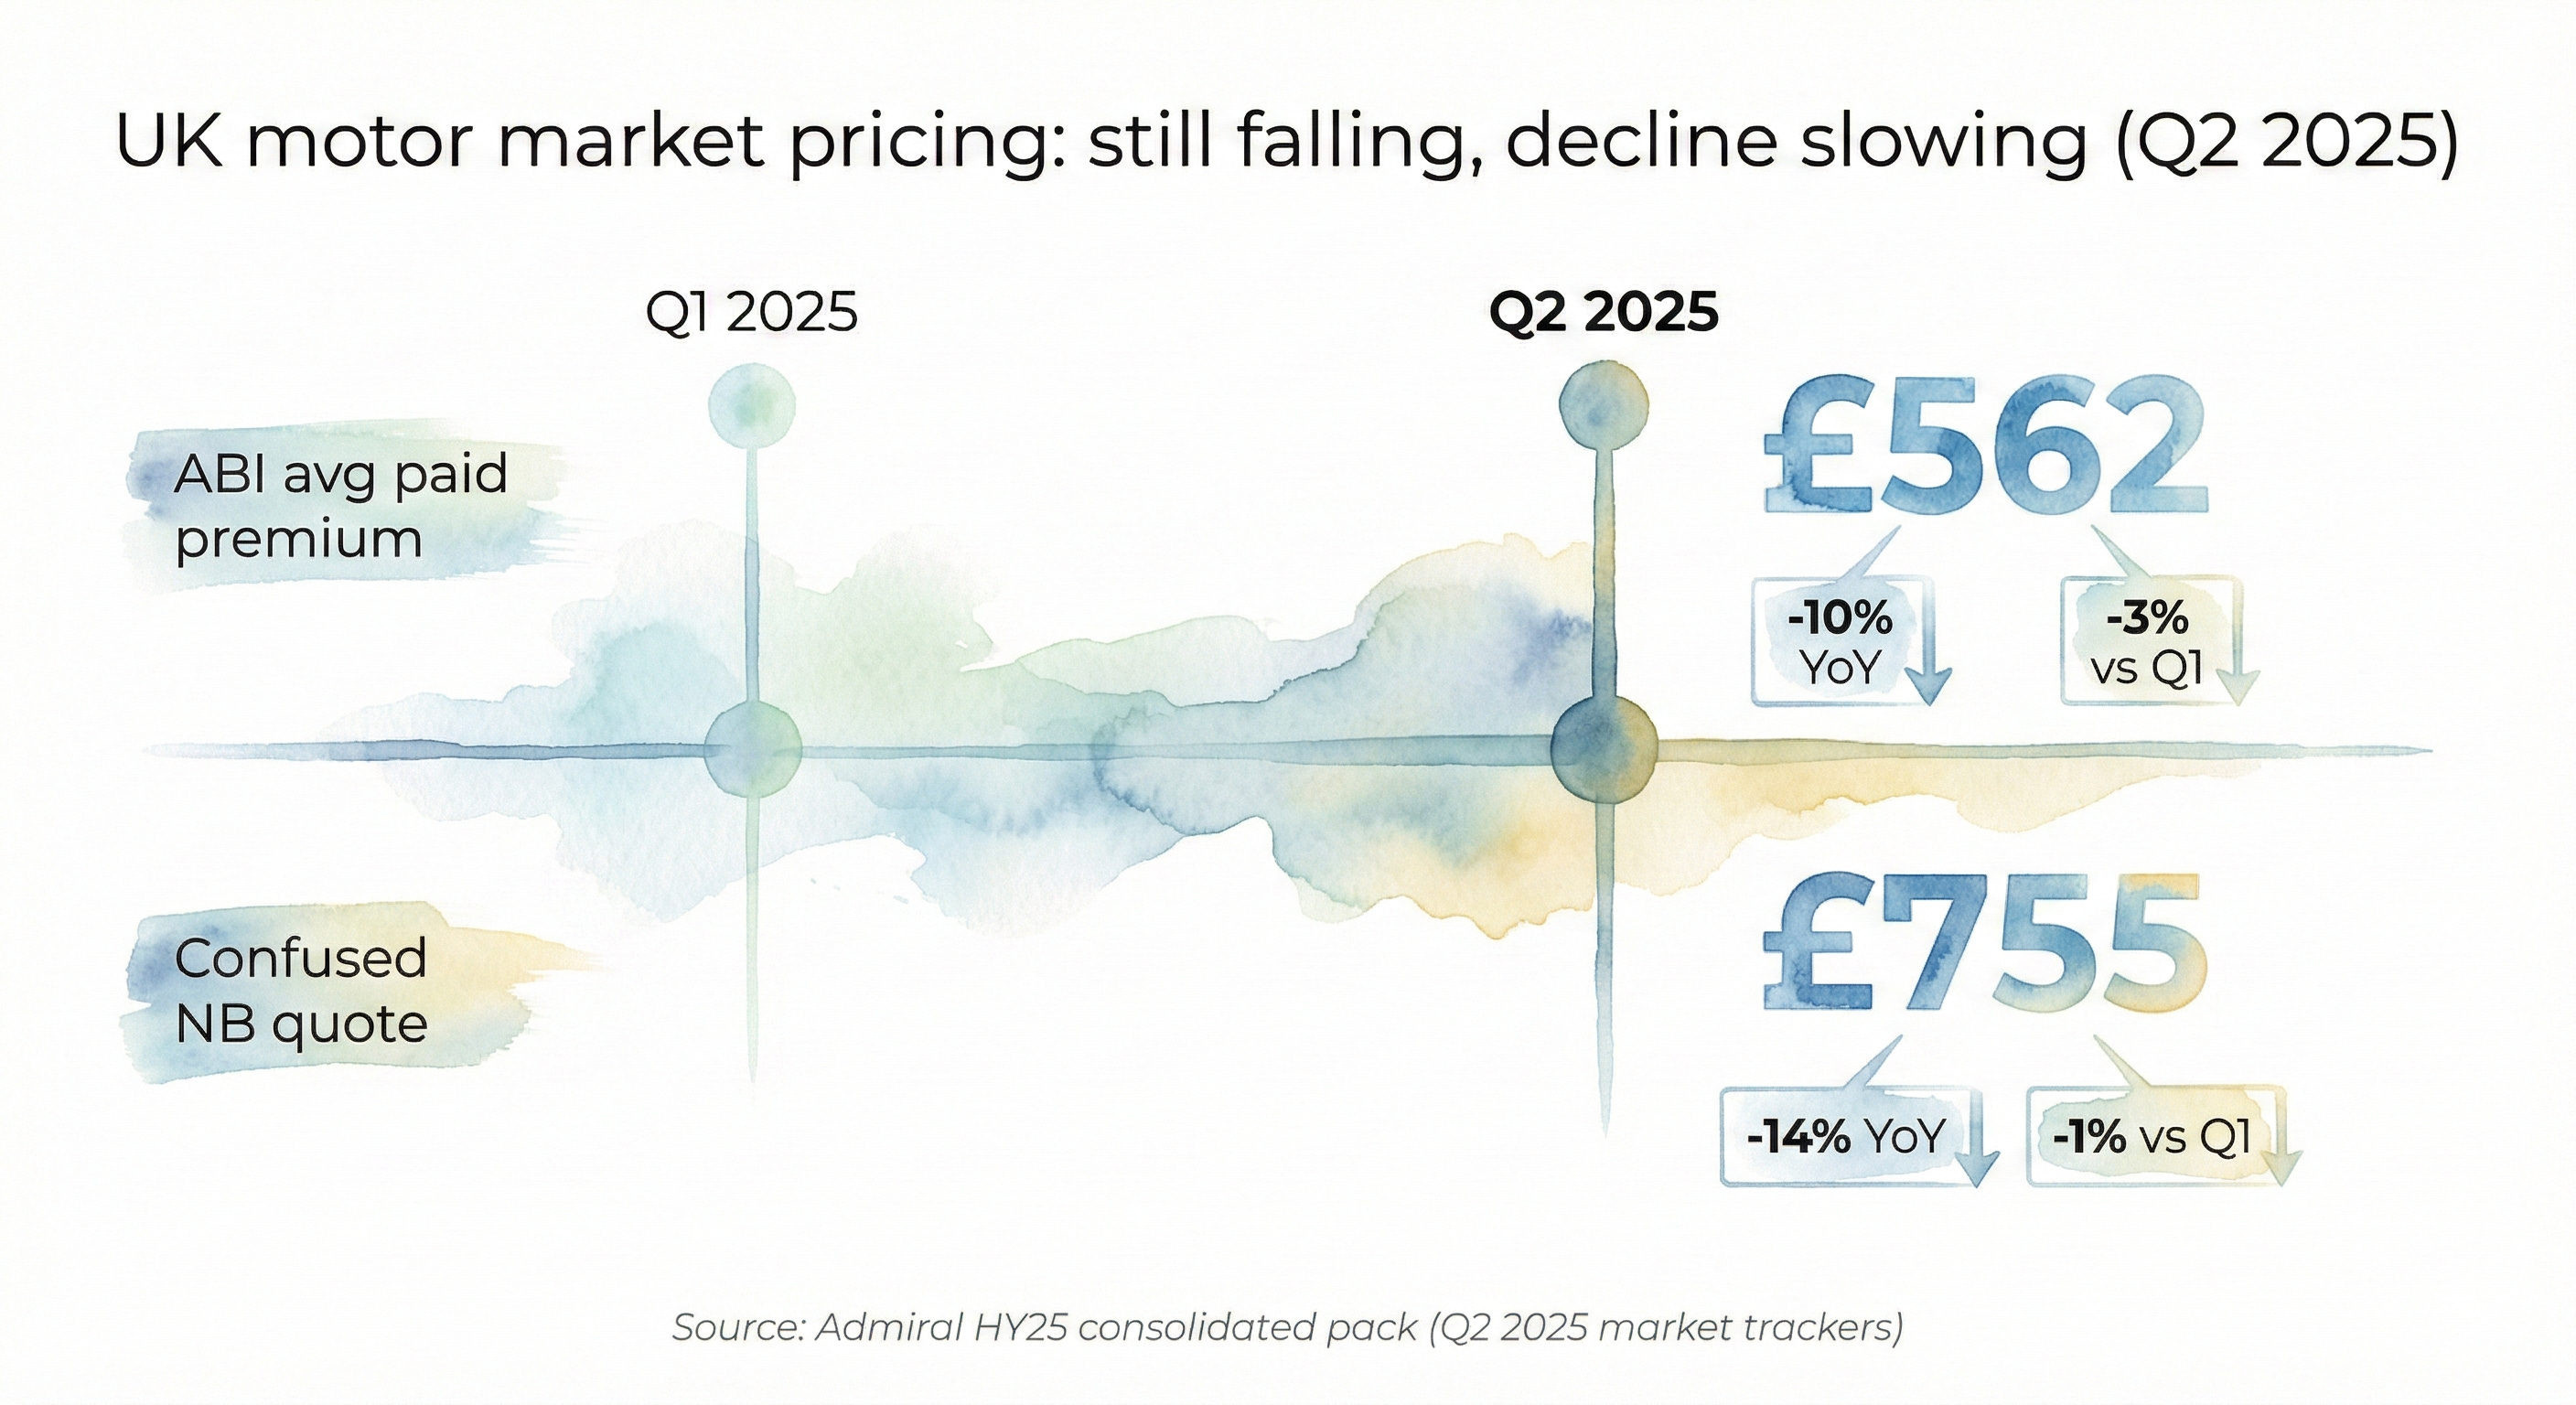
That “slowing decline” is the cycle pivot point Admiral cares about. Not because lower prices are “good,” but because a softer rate environment tests whether you can grow without buying bad business.
The Cleanup on Aisle 4: Then you have the operational clean-up: the Total Loss review. It’s completed, actions are expected to start in H2, and the estimated total cost is c.£50m (GBP).
Does this matter? Yes. It tells you something about management’s control posture. Either it’s a bounded fix that cleans up a process, or it’s the first crack in the claims discipline story. The number itself is less important than whether it stays contained.
Europe: Europe is another “fix it” theatre. The Europe combined ratio improved to 98.3% (H1 2025, %, as presented) but profitability is still around breakeven to slightly negative (H1 2025, GBP, as presented).
That’s not a meltdown. But it is a reminder that “international diversification” often means “learning expensive lessons in public.”
Atomic Take: Nothing here screams “broken model,” but the cycle + operational clean-ups are exactly how good insurers get humbled.
Falsifier: If Total Loss remediation costs drift materially above c.£50m (GBP, as presented) or expand into a broader claims-control problem, run for the hills.
The Dashboard, The Report Card, and The Plumbing
So, Admiral is a cash-generating machine in a boring industry.
Now, let’s talk about what keeps the machine running—and what could break it.
Most companies try to dazzle you with “synergies” and “AI-driven flywheels.” Admiral doesn’t do that. They have a dashboard of simple, mechanical dials. Our job is to stare at them until our eyes water.
Rebound Catalysts: No Moonshots, Just Mechanics
Admiral’s catalysts are refreshingly measurable. There is no magic here. Just a handful of inputs that will either stay stable or betray you.
Catalyst 1: The Pricing Plateau
The market pricing is stabilizing. This is crucial. We don’t need prices to skyrocket; we just need them to stop plummeting so we can grow without hurting ourselves.
The Fact: Q2 2025 market trackers show ongoing declines, but the bleeding is slowing. The ABI index sits at £562 (GBP), and Confused is at £755 (GBP).
The Monitor: Watch this like a hawk. If the “slowing” stops and the freefall continues, or if Admiral tries to grab market share while prices are dropping, run.
Catalyst 2: The Golden Goose (UK Motor)
Can the core business stay elite when the easy money is gone?
The Fact: UK Motor profit before tax was £559m (H1 2025, GBP) with a Combined Ratio of 71.2% (H1 2025, %, as presented).
The Hypothesis: Even as the “rate tailwinds” (easy price hikes) fade, Admiral wins because they are simply better at the boring stuff: answering phones, processing claims, and pricing risk.
The Monitor: Watch the split between the loss ratio and the expense ratio. If either creeps up, the edge is dulling.
Catalyst 3: The “Beyond Motor” Dream
Can they sell something other than car insurance without losing their shirt?
The Fact: Household profit before tax was £25m (H1 2025, GBP) and the Household combined ratio was 83.9% (H1 2025, %, as presented).
The Hypothesis: They are taking the “Motor Playbook” (obsessive discipline) and exporting it to home insurance. It looks like it’s working.
The Monitor: Consistency. One good half-year is luck; three is a trend.
Catalyst 4: Admiral Money (The Side Hustle)
This needs to be a recurring earnings stream, not a one-off transaction factory.
The Fact: Admiral Money profit before tax was £16m (H1 2025, GBP). BUT—and this is a big but—this includes £10m from the sale of back book loans. On-balance sheet loans are now £1.28bn (as of 30 Jun 2025, GBP).
The Monitor: Strip out the one-offs. I want to see credit outcomes (are people paying them back?) and recurring profit.
Catalyst 5: The “Free Lunch” (Investment Income)
Finally, interest rates are helping us.
The Fact: Investment income was £99m. The underlying investment income yield is 3.9%, and they are reinvesting at a rate of ~4.5% with a bond duration of ~3.0 years.
The Monitor: This is a nice tailwind. As long as they don’t get cute and buy risky junk bonds, this is free money.
Atomic Take: The catalyst stack is clean. If the insurance cycle stays merely “less good” rather than “disastrous,” this model works.
Falsifier: If the Group combined ratio rises meaningfully above 77.7% while the customer count fails to grow from 11.4m, the growth story is dead.
The Financial Quality Report Card

I like to grade companies like I’m a strict schoolteacher. Let’s see how Admiral scores on the “Sleep Well at Night” rubric.
1. Underwriting Discipline: 5/5 (Elite)
A 77.7% group combined ratio (H1 2025, as presented) is world-class. It’s the Steph Curry of insurance stats. The only question is durability, not competence.
2. Expense Control: 4/5 (Improving)
The expense ratio improved to 20.3% from 22.8% (H1 2025 vs H1 2024, %). That is real operating leverage. If they can keep costs down while pricing softens, that’s a massive competitive advantage.
3. Capital Strength: 4/5 (Solid)
Solvency is 194% (H1 2025). That is a fortress. But remember, this is a dial, not a static number. When you pay out huge dividends, you are draining the moat. Watch it closely.
4. Cash-to-Dividend Coherence: 3/5 (Murky)
This isn’t Admiral’s fault; it’s the industry. Insurance cash flow is a timing instrument. You get paid today for a crash that might happen next year. Dividend debates in this sector are where investors lose their hair.
5. Diversification Quality: 3/5 (Promising but Unproven)
Household looks legitimate (profitable, strong combined ratio). Europe is improving but still hovering around breakeven. Admiral Money has promise, but that H1 profit included a notable one-time boost. I need to see more “boring” profit here.
6. Earnings Transparency: 3/5 (Standard)
Insurance is inherently a timing business. Admiral discloses a lot—more than most—but your job as an investor is to separate “cycle luck” from “structural genius.”
Stop & Think: Admiral reports an ROE of 57% (H1 2025, %, as presented). That number is fantastic. But be careful. In insurance, a super-high ROE is often a warning sign that the cycle is peaking. It’s an outcome of the moment, not a permanent law of nature.
Atomic Take: The quality is real, but the market is unforgiving. It will treat any crack in underwriting as radioactive.
Falsifier: If Solvency trends down materially from 194% (H1 2025, %) while underwriting ratios also deteriorate, the safety net is gone.
The Balance Sheet: The Geiger Test
Let’s look at the plumbing. We start with what can kill you: Liabilities.
Total Assets: £8,632.8m (as of 30 Jun 2025, GBP).
Total Equity: £1,435.8m (as of 30 Jun 2025, GBP).
Insurance Contract Liabilities: £5,261.2m (as of 30 Jun 2025, GBP).
Subordinated/Other Liabilities: £1,509.7m (as of 30 Jun 2025, GBP).
Cash and Investments: £5,427.8m (as of 30 Jun 2025, GBP), including cash of £319.2m (as of 30 Jun 2025, GBP).
The Translation: These numbers describe a specific shape: A massive investment base sitting alongside massive potential bills (liabilities), with a layer of Equity sandwiching them together. This is normal for an insurer.
The risk isn’t the structure. The risk is the alignment. Are the assets (cash/investments) safe enough and liquid enough to pay the liabilities when they come due?
Hypothesis: Admiral’s balance sheet is a “containment vessel.” It supports a high distribution model (big dividends) because the underwriting engine throws off enough profit to refill the tank, and the investment base is managed conservatively.
Monitor: Watch Solvency versus payout behaviour. If they start changing the investment mix to chase higher yields (buying junk bonds or weird derivatives), it means the underwriting engine is sputtering.
Falsifier: If Solvency falls materially below 194% (H1 2025 baseline) alongside any sign that the dividend framework is becoming “rigid” (paying out more than they should just to keep the stock price up), get out.
Cash Flow: The Turbine
Insurance cash flow is where investors invent ghosts. They see huge numbers moving in and out and panic.
FACT: Net cash flow from operating activities was £240.0m (H1 2025, GBP).
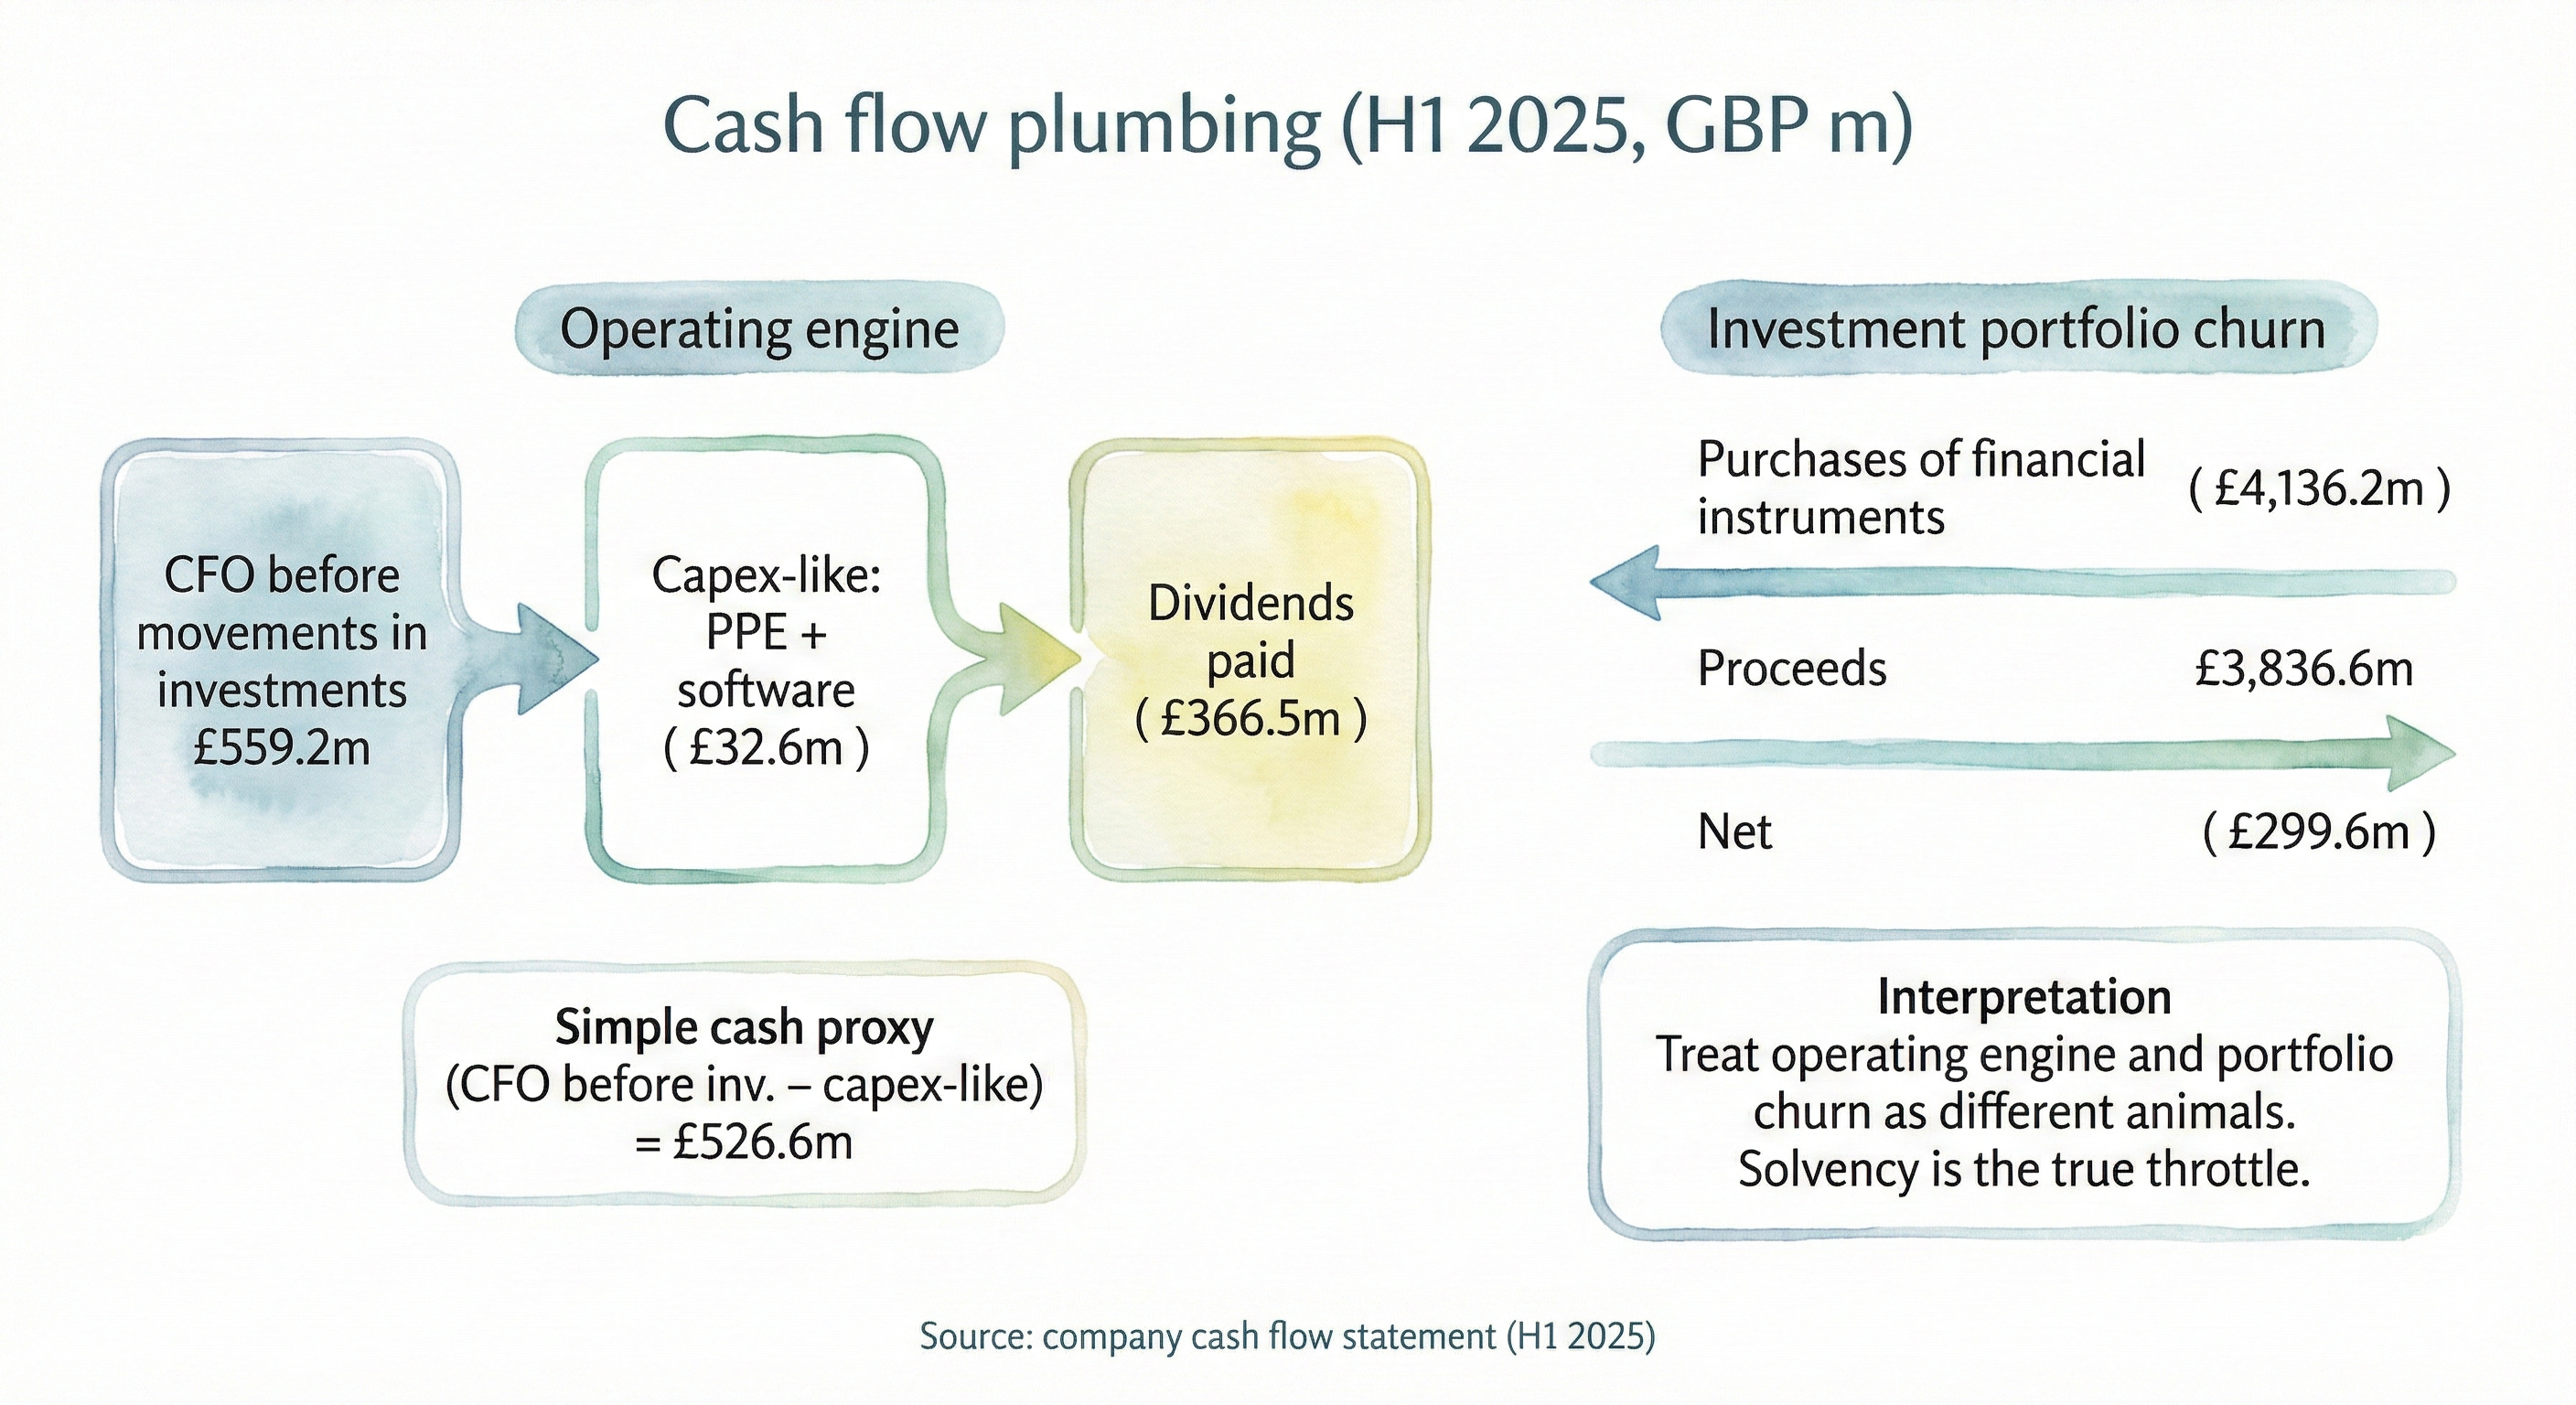
FACT: Cash flow from operating activities before movements in investments was £559.2m (H1 2025, GBP).
FACT: Purchases of property, equipment and software were ( £32.6m ) (H1 2025, GBP).
FACT: Equity dividends paid were ( £366.5m ) (H1 2025, GBP).
The Translation: Here is the clean way to read this without getting emotionally injured.
First, ignore the headline “Net cash flow” number. Why? Because insurers have massive investment portfolios that churn constantly. If they buy a bond, it looks like cash leaving the building. It isn’t. It’s just moving from the left pocket (cash) to the right pocket (investments).
Look at the “Operating cash before movements in investments” line: £559.2m. That is the real cash engine. Subtract the “capex” (buying computers and desks): £32.6m.
The Napkin Math:
Real Cash In: ~£526.6m (£559.2m - £32.6m)
Dividends Paid Out: £366.5m
The turbine is working. The cash coming in covers the dividend with room to spare.
Atomic Take: The turbine works. The investor’s job is to keep the turbine connected to solvency reality, not to a simplistic “cash cover” meme.
Falsifier: If Cash flow (before investment moves) drops materially from £559.2m (H1 2025 baseline) while dividends paid stay high, the tank is leaking.
Income Statement: The Reactor
The P&L is where Admiral looks most obviously attractive—and where the “seasoning” matters most.
Underwriting Purity: Group combined ratio was 77.7% (H1 2025, %, as presented). This is the steak.
The Seasoning: Management notes an estimated additional Ogden benefit of c.£15–20m included in profit. Also, Admiral Money profit includes £10m from the sale of back book loans.
The Audit: These “seasoning” items don’t make the result fake. But they do mean you should be careful about annualising the headline number. If you strip them out, the business is still profitable, just slightly less “record-breaking.”
Atomic Take: The reactor is running hot and clean right now—but you don’t call it “normalised” until it survives a softer pricing environment without the extra spices.
What about the valuation?
Now we’ve kicked the tires (the business model) and checked the engine (the catalysts). Now we need to look at the fuel gauge (cash flow) and decide if the asking price is a bargain or a rip-off.
Most investors get lost here. They drown in spreadsheets. We are going to keep it simple. We are going to value this business like we’re buying a local laundromat, not a spaceship.
We have two key inputs and one dangerous temptation.
Price: ~£30.3 per share (16 Jan 2026).
EPS: 132.5p (H1 2025, pence)
The Temptation: The lazy move is to double the H1 EPS and declare victory.
Run-rate EPS ≈ 132.5p × 2 = 265.0p.
Implied PE Multiple: ~3,030p / 265.0p ≈ ~11.4x.
The Sentiment Meter: At 11.4x earnings, the market is not paying a premium for perfection. It’s pricing in skepticism. It’s saying, “We know this is peak earnings, and we don’t believe it will last.”
This is where the opportunity lives. If the market is pricing in a crash, and you only get a “soft landing,” you make money.
Atomic Take: At ~11.4x annualised H1 EPS, the market is pricing durability, not heroics. The bet here is on underwriting persistence, not financial engineering.
Risks: The Meltdown List
What kills us? Let’s be specific.
Cycle Risk: Market pricing is still declining (Q2 2025 ABI £562). If this accelerates, margins get crushed.
Inflation: Management shows indexed market total burn cost rising. If inflation beats pricing, game over.
The “Fix-It” Bill: The Total Loss review cost is c.£50m. If this number grows, or if they find another closet full of skeletons, the stock tanks.
The Sneaky Risk (Dividend Rigidity): The policy is to pay 65% of post-tax profits. The market loves this. But if profits drop and they keep paying out to keep the stock up, they destroy the balance sheet.
Admiral Money: On-balance sheet loans are £1.28bn. If the economy tanks, these loans could go bad fast.
Atomic Take: The failure mode isn’t a single explosion; it’s a slow squeeze—pricing down, claims up, and dividends becoming a trap.
The Atomic Verdict
Status: ★★★★☆ (3.9/5)
Earned by underwriting quality, discounted for cycle exposure.
Status: Watchlist (Defensive-ish, with explicit cycle sensitivity).
The Pro Case: It rests on two measurable pillars:
Elite Underwriting: A 71.2% combined ratio in UK Motor is not “fine.” It is world-class.
Capital Return: They have a fortress balance sheet (194% Solvency) and they actually give the money back to you (115.0p interim dividend).
The Skeptical Case: The market is softening. The “easy money” period of hard pricing is over. Now we find out if Admiral is a structural genius or just a surfer who caught a good wave.
The Cheat Sheet: When to Buy, When to Sell
(Important; the following is not financial advice but only meant as guidelines for what I think is important to focus on IF you decide to research the stock further)
UPGRADE TRIGGERS (Green Light)
Group combined ratio stays at or below 77.7% while customers grow above 11.4m.
Household continues profitable scaling with combined ratio staying around 83.9%.
Admiral Money grows beyond £1.28bn with recurring profit (no more one-off sales).
DOWNGRADE TRIGGERS (Red Light)
UK Motor combined ratio deteriorates meaningfully above 71.2% and stays there.
Remediation costs exceed c.£50m or we hear the phrase “another review.”
Solvency trends down materially from 194% while they keep paying aggressive dividends.
Stop & Think: Great investing isn’t about being smarter than everyone else. It’s about being more disciplined. Admiral is a test of discipline—theirs and yours.
So, let’s circle back to where we started.
Right now, the market is screaming at you to buy the future. It wants you to pay 50x earnings for a company that might mine asteroids or solve general intelligence in 2032. It’s exciting. It’s sexy. It makes for great dinner party conversation.
But remember Shelby Cullom Davis.
He didn’t build his dynasty by guessing the future. He built it by betting on the things that never change. People will always crash their cars. They will always need someone to pay for it. And they will always hate paying their premiums.
Admiral is the embodiment of that “unsexy” truth.
While the rest of the world is looking at the stars, Admiral is staring at the spreadsheet. While tech bros are talking about “total addressable markets in the trillions,” Admiral is arguing about how to save £5 on a bumper repair.
At ~11x earnings, you aren’t paying for a dream. You are paying for a machine.
Is Admiral going to be the next Nvidia? No. But Shelby Davis didn’t need Nvidia. He just needed a company that compounded capital, respected the downside, and didn’t get high on its own supply.
The question you have to answer this weekend isn’t about interest rates or AI. It’s much simpler: Are you willing to be bored enough to get rich?
References
Admiral Group plc — HY25 consolidated pack (results presentation + financial statements), dated 14.08 (PDF).
Admiral Group plc — ADM-Admiral Group PLC.xlsx (company-provided financial statement spreadsheet used for cash flow and supporting line items).
Admiral Group plc — UKI (PDF) (business model / UK Insurance operational context as presented).
Admiral Group plc — Video transcript (PDF)
Disclaimer
This Deep Dive is an educational breakdown of a public company based on information available in the materials provided (e.g., annual/quarterly reports, investor presentations, earnings transcripts) and my interpretation of that information. It is designed to be a “bolt-on” intelligence layer to your own due diligence — not a replacement for it.
Independence: I do not accept compensation of any kind from the companies discussed. My research is driven solely by my personal search for high-quality compounders.
Skin in the Game: Unless otherwise stated, assume the author may hold a long position in securities mentioned. Any position creates bias — treat this as commentary, not gospel.
Not Financial Advice: Nothing here is investment advice, a recommendation, or a solicitation. I am not a financial advisor. You are responsible for your own decisions. The stars rating is not a buy recommendation, but meant as a guide to understand the quality of the financial statement of the respective companies.
Error & Update Risk: Financial statements change, companies restate, guidance evolves, and I can be wrong. Verify key figures in the primary filings and consider reading the footnotes before deploying capital.
Interesting find; thanks for the write up. One of the strongest combined ratios I've seen thus far, similar to Kinsale in the US, but with more mainstream business lines. One would have to get comfortable with the Money segment, as that appears to be stepping outside their circle of competency.