

Deep Dive: Evolution AB: The Money Machine with Sand in the Gears.
64% Margins, Cyber Sabotage, and the 10% Yield No One Wants to Touch


Note: I built this analysis using the latest Q3 2025 numbers, but I leaned heavily on the FY2024 Annual Report as well, because that is where the company explicitly details the risks we need to have in mind (cyber threats, regulatory friction, and customer concentration). So I used it to ensure we aren't flying blind.
IF YOU’RE IN A RUSH
The Elevator Pitch:
Evolution is the production studio for online casinos. They hire the card dealers, run the video cameras, and stream the live footage to gambling websites. They provide the live dealers and the random number generator (RNG) games. They sell this to gaming operators, mostly on a commission model.
When the operator makes a profit on an Evolution table, Evolution takes a cut. They also charge fees for setting up fancy, dedicated environments.
Why the Stock is in the Penalty Box:
The latest scorecard was soft. In Q3 2025, net revenues came in at €507.1m (IFRS), down 2.4% YoY. Management is being brutally honest about the mess: “Asia remains volatile,” and they are dealing with real-world operational disruption and cyber attacks.
The Fix:
Three things need to happen:
Asia needs to stabilize.
The product machine needs to keep firing (management outlook is 110+ new games in 2025).
The costs of regulatory plumbing need to stop shaving the clean edges off their margins.
Atomic Position: Overhang-Heavy. The economics are still elite, but the operational and regulatory fog is still in the room. We need the windshield to clear up.
THE SETUP
Folks, let’s be clear: Evolution’s 2024 and 2025 was not a collapse. It was a warning label stuck on a very profitable machine.
And make no mistake, this machine prints cash.
In FY2024, total operating revenues were €2,214.1m (IFRS) and operating profit (EBIT) hit €1,419.6m. That is a 64.1% EBIT margin.
In the world of physical businesses, that number is usually a typo. Here, it’s reality.
The business is also steadily becoming “more regulated-market shaped.” Regulated markets made up 40% of net revenues in FY2024, which is stable compared to 2023.
Stop & Think: Why does this matter? Regulation is a double-edged sword. On one side, it’s a moat—you need licenses, compliance, and trust to play. On the other side, it’s a tax. It demands ring-fencing, audits, and friction.
Management knows the narrative is getting messy, so they are trying to out-ship the bad news. They are calling 2024–2025 “product leap years.”
They launched 109 new games in 2024, and the outlook calls for 110+ new games in 2025.
Here is the argument on Wall Street:
The Market View: “Sure, margins are huge. But growth is wobbling and the world is tightening the screws on gambling. The party is getting raided.”
The Bull View: “This is the best content factory and distribution stack in online casino history. The disruptions are temporary. The capital returns will keep compounding value per share.”
The Bear View: “Regulators, cyber attacks, and operator concentration mean Evolution is being forced into a lower-power mode… permanently.”
This deep dive is about answering one single question: Are the recent disruptions just turbulence around a compounding machine, or is the machine being forced into a structurally slower, more expensive way of life?
Atomic Take: Evolution can be both “still exceptional” and “not currently clean enough for High Conviction.” Our job is to separate temporary noise from permanent friction.
Falsifier: If net revenues stay negative YoY for multiple quarters while management maintains the 66–68% margin framework, the “temporary turbulence” story stops fitting the data.
HOW THE BUSINESS ACTUALLY MAKES MONEY
Let’s strip away the corporate speak. Evolution sells online casino infrastructure and content to operators. The operator owns the customer (the gambler). Evolution supplies the engine.
The revenue model isn’t complicated, which is exactly why it’s so powerful.
1. The Commission (The Main Event):
Most revenue comes from commission, calculated as a percentage of the operator’s profit generated by Evolution’s platform. This is perfect alignment. If Evolution helps an operator earn more money, Evolution earns more money. It scales beautifully.
2. The “Bespoke” Fees:
Evolution also earns fees for dedicated tables and environments. Think of this as selling “premium real estate” inside the casino. An operator wants branded tables, VIP setups, or dedicated dealers? They pay for the privilege.
3. The Secret Sauce: The Operating System
Now, here is the part investors routinely underweight. Evolution isn’t just a library of video games. It’s an operating system plus a broadcast-quality production machine.
Evolution’s “One Stop Shop” (OSS) is a single integration layer and unified back office across its brands. It is explicitly positioned to make integration faster and simpler. It’s the base for distributing more products to more operators.
And reliability? It’s not a “nice to have.” In live casino, reliability is the permission slip to be the default supplier.
System availability was 99.96% in 2024, excluding scheduled maintenance.
That is incredible. That is “TV-studio” reliability.
The distribution breadth is real, too. Evolution had about 800 customers at the end of 2024. While concentration exists (we’ll get to that later), this platform isn’t a one-client wonder.
But make no mistake, this business is still mostly about the Live Dealer.
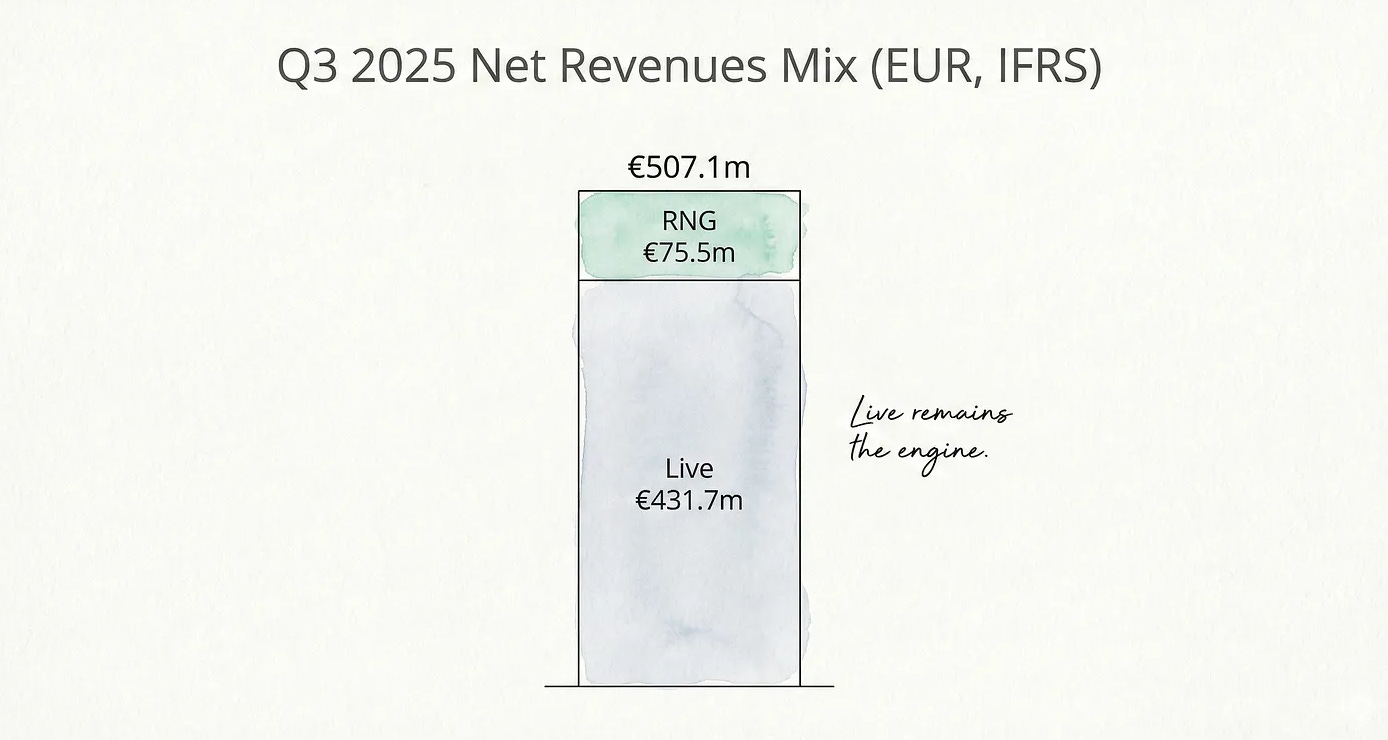
In Q3 2025, Live net revenues were €431.7m.
RNG (slots/animated) net revenues were €75.5m (IFRS).
The Flywheel: Build content at scale → Distribute it through one integration stack (OSS) → Keep uptime high → Earn commission that scales with the operator’s success.
Atomic Take: Evolution’s real product is “operator-grade casino infrastructure.” The content is the bait; the integration and uptime are the handcuffs.
Falsifier: If availability (2024: 99.96%) degrades meaningfully while competition intensifies, the “infrastructure moat” claim weakens fast.
WHAT WENT WRONG
So, if the machine is so good, why is the stock giving people heartburn?
2024 wasn’t a meltdown. It was operational reality asserting itself. Management describes two categories of pain, and neither is “players stopped playing.”
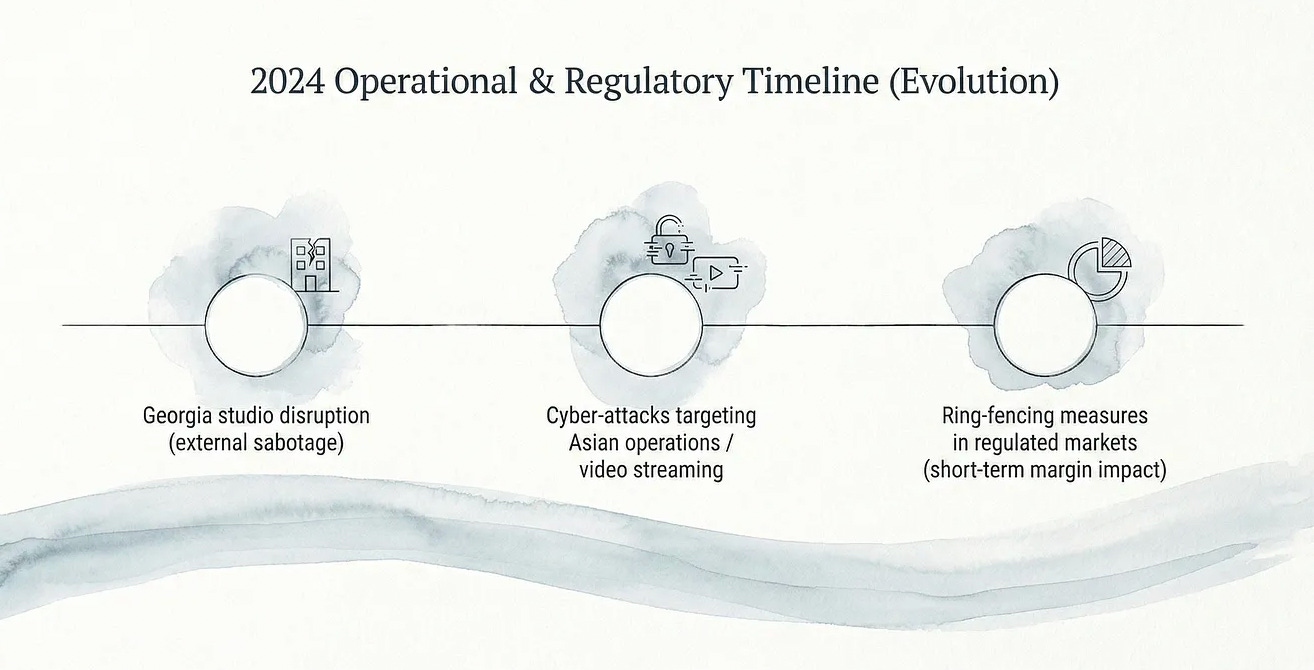
1. Physical Disruption (The Real World):
The CEO describes disruptions at the Georgia studio caused by external sabotage. This isn’t just code breaking; this is physical interference.
2. The Cyber War:
They faced cyber-attacks targeting Asian operations, including sophisticated attacks against video streaming.
Management says this contributed to slower growth than in prior years. More importantly, they warned that the measures taken to fix this are expected to affect growth for “some quarters ahead.”
Stop & Think: This matters because Evolution is operationally heavy. Live casino isn’t pure software. It’s studios, dealers, cameras, streaming, monitoring, and compliance. When the video feed gets attacked, you interrupt the “always on” expectation that operators depend on.
3. The Regulatory Plumbing:
This is less dramatic than sabotage, but arguably more important. Evolution describes implementing technical measures to ring-fence locally regulated markets. This ensures games are available only through locally licensed B2C operators where local licenses exist.
They noted that these adjustments affected margins in the short term. “Regulated markets” being 40% of net revenues doesn’t tell you how hard it is to operate inside those markets. It tells you where the money is showing up. The friction shows up in costs, process, and occasionally headlines.
The Scorecard:
Q3 2025 put numbers on the bad vibes.
Net revenues: €507.1m (IFRS), down 2.4% YoY.
Adjusted EBITDA margin: 66.4% (company-defined non-IFRS).
So the “break” isn’t “the model stopped working.” It’s that the model got stress-tested in the two places you least want surprises: operations (disruption/cyber) and compliance plumbing (ring-fencing).
Atomic Take: Evolution’s bear case isn’t “bad games.” It’s “a world-class machine forced to run with sand in the gears.”
Falsifier: If Asia is described as “volatile” quarter after quarter while net revenues remain negative YoY, the “one-off disruption” framing stops being credible.
REBOUND CATALYSTS
Catalysts must be testable, or they are just motivational posters hanging in the breakroom. We don’t invest in “hope”; we invest in “evidence.”
Here is the checklist to see if this machine is getting back on the highway:
1. The Asia Repair Job
Management still frames Asia as having huge long-term potential. But they are also admitting the region has been hit by cyber-attacks and remains “volatile.”
HYPOTHESIS: If the cyber mitigation works and the operational routing holds up, Asia stops being a drag and becomes neutral-to-positive again.
MONITOR: Watch the quarterly commentary like a hawk. Does the phrase “Asia remains volatile” disappear from the outlook? Do they stop talking about streaming disruptions? Silence is golden here.
2. The Relentless Product Conveyor Belt
Evolution is trying to build its way out of trouble. They are calling 2024–2025 “product leap years.” They launched 109 new games in 2024, and the outlook said 110+ new games in 2025.
HYPOTHESIS: High release cadence plus that “One Stop Shop” (OSS) distribution keeps their share of the operator’s wallet rising, even if the total market slows down.
MONITOR: The Live vs. RNG split. In Q3 2025, it was €431.7m Live vs. €75.5m RNG. We need to see if RNG momentum is real, or just marketing copy pasted into the earnings slides.
3. The Margin Moat
The outlook maintains a margin estimate of 66–68%. That is the line in the sand.
HYPOTHESIS: Evolution can keep margins in that elite range while spending enough to fix the plumbing and defend the moat.
MONITOR: Whether ring-fencing and compliance measures continue being cited as margin headwinds. If the costs stay high, the moat is leaking.
4. The Shareholder Paycheck
The Q3 2025 material repeats the promise: a minimum of 50% of net profit and 100% of excess cash goes back to you. They also flagged a repurchase intention of €500m for 2025.
In Q3 2025 alone, repurchases were €187.0m.
Year-to-date 2025 by Q3, they bought back €406.5m.
Atomic Take: The rebound setup is straightforward: Stabilize Asia, keep shipping new games, and let the capital return engine do its thing. But each piece has a measurable scoreboard.
Falsifier: If the margin estimate (66–68%) holds, but operating cash flow after investments (Q3 2025: €342.1m) starts to shrink materially, something is leaking in the engine room.
Accounting profit is nice; cash is truth.
FINANCIAL QUALITY RUBRIC (1–5)

Let’s grade the exam paper.
Margins / Scalability: 5/5
FY2024 EBIT margin was 64.1% (IFRS) and adjusted EBITDA margin was 68.4%. Folks, these are software monopoly numbers.
The economics remain exceptional. It costs them very little to add the next million dollars of revenue.
Cash Generation: 4/5
In Q3 2025, operating cash flow after investments was €342.1m.
Cash conversion was 83%.
That is a cash cannon. However, don’t ignore the fine print: working capital contributed €35.2m to that number. That’s a temporary tailwind, not a permanent feature.
Balance Sheet Resilience: 4/5
As of 30 Sep 2025, cash and cash equivalents stood at €656.4m and the bond portfolio was €103.2m. Total equity was €3,819.6m (IFRS).
This is not a distressed asset. This is a fortress. They aren’t answering angry calls from the bank.
Customer Concentration Risk: 2/5
The top customer was 13% of net revenues in 2024. The top five were 46%. This is the “Whale Risk.”
It’s not fatal, but it is absolutely a “one operator can bruise a quarter” setup. If a big client sneezes, Evolution catches a cold.
Operational Robustness: 3/5
System availability in 2024 was 99.96% (excluding scheduled maintenance). That is world-class.
So why the low score?
Because the battlefield is hostile. The year included sabotage and cyber disruption. The system is excellent; the environment is dangerous.
Regulatory/Tax Durability: 3/5
The government is coming for its cut.
The effective tax rate increased to 13.5% in FY2024 (up from 6.8% in 2023). The annual report expects Pillar II changes to increase the effective tax rate from 1 Jan 2024.
The model is so profitable it can absorb taxes easily, but the uncertainty taxes the stock’s multiple.
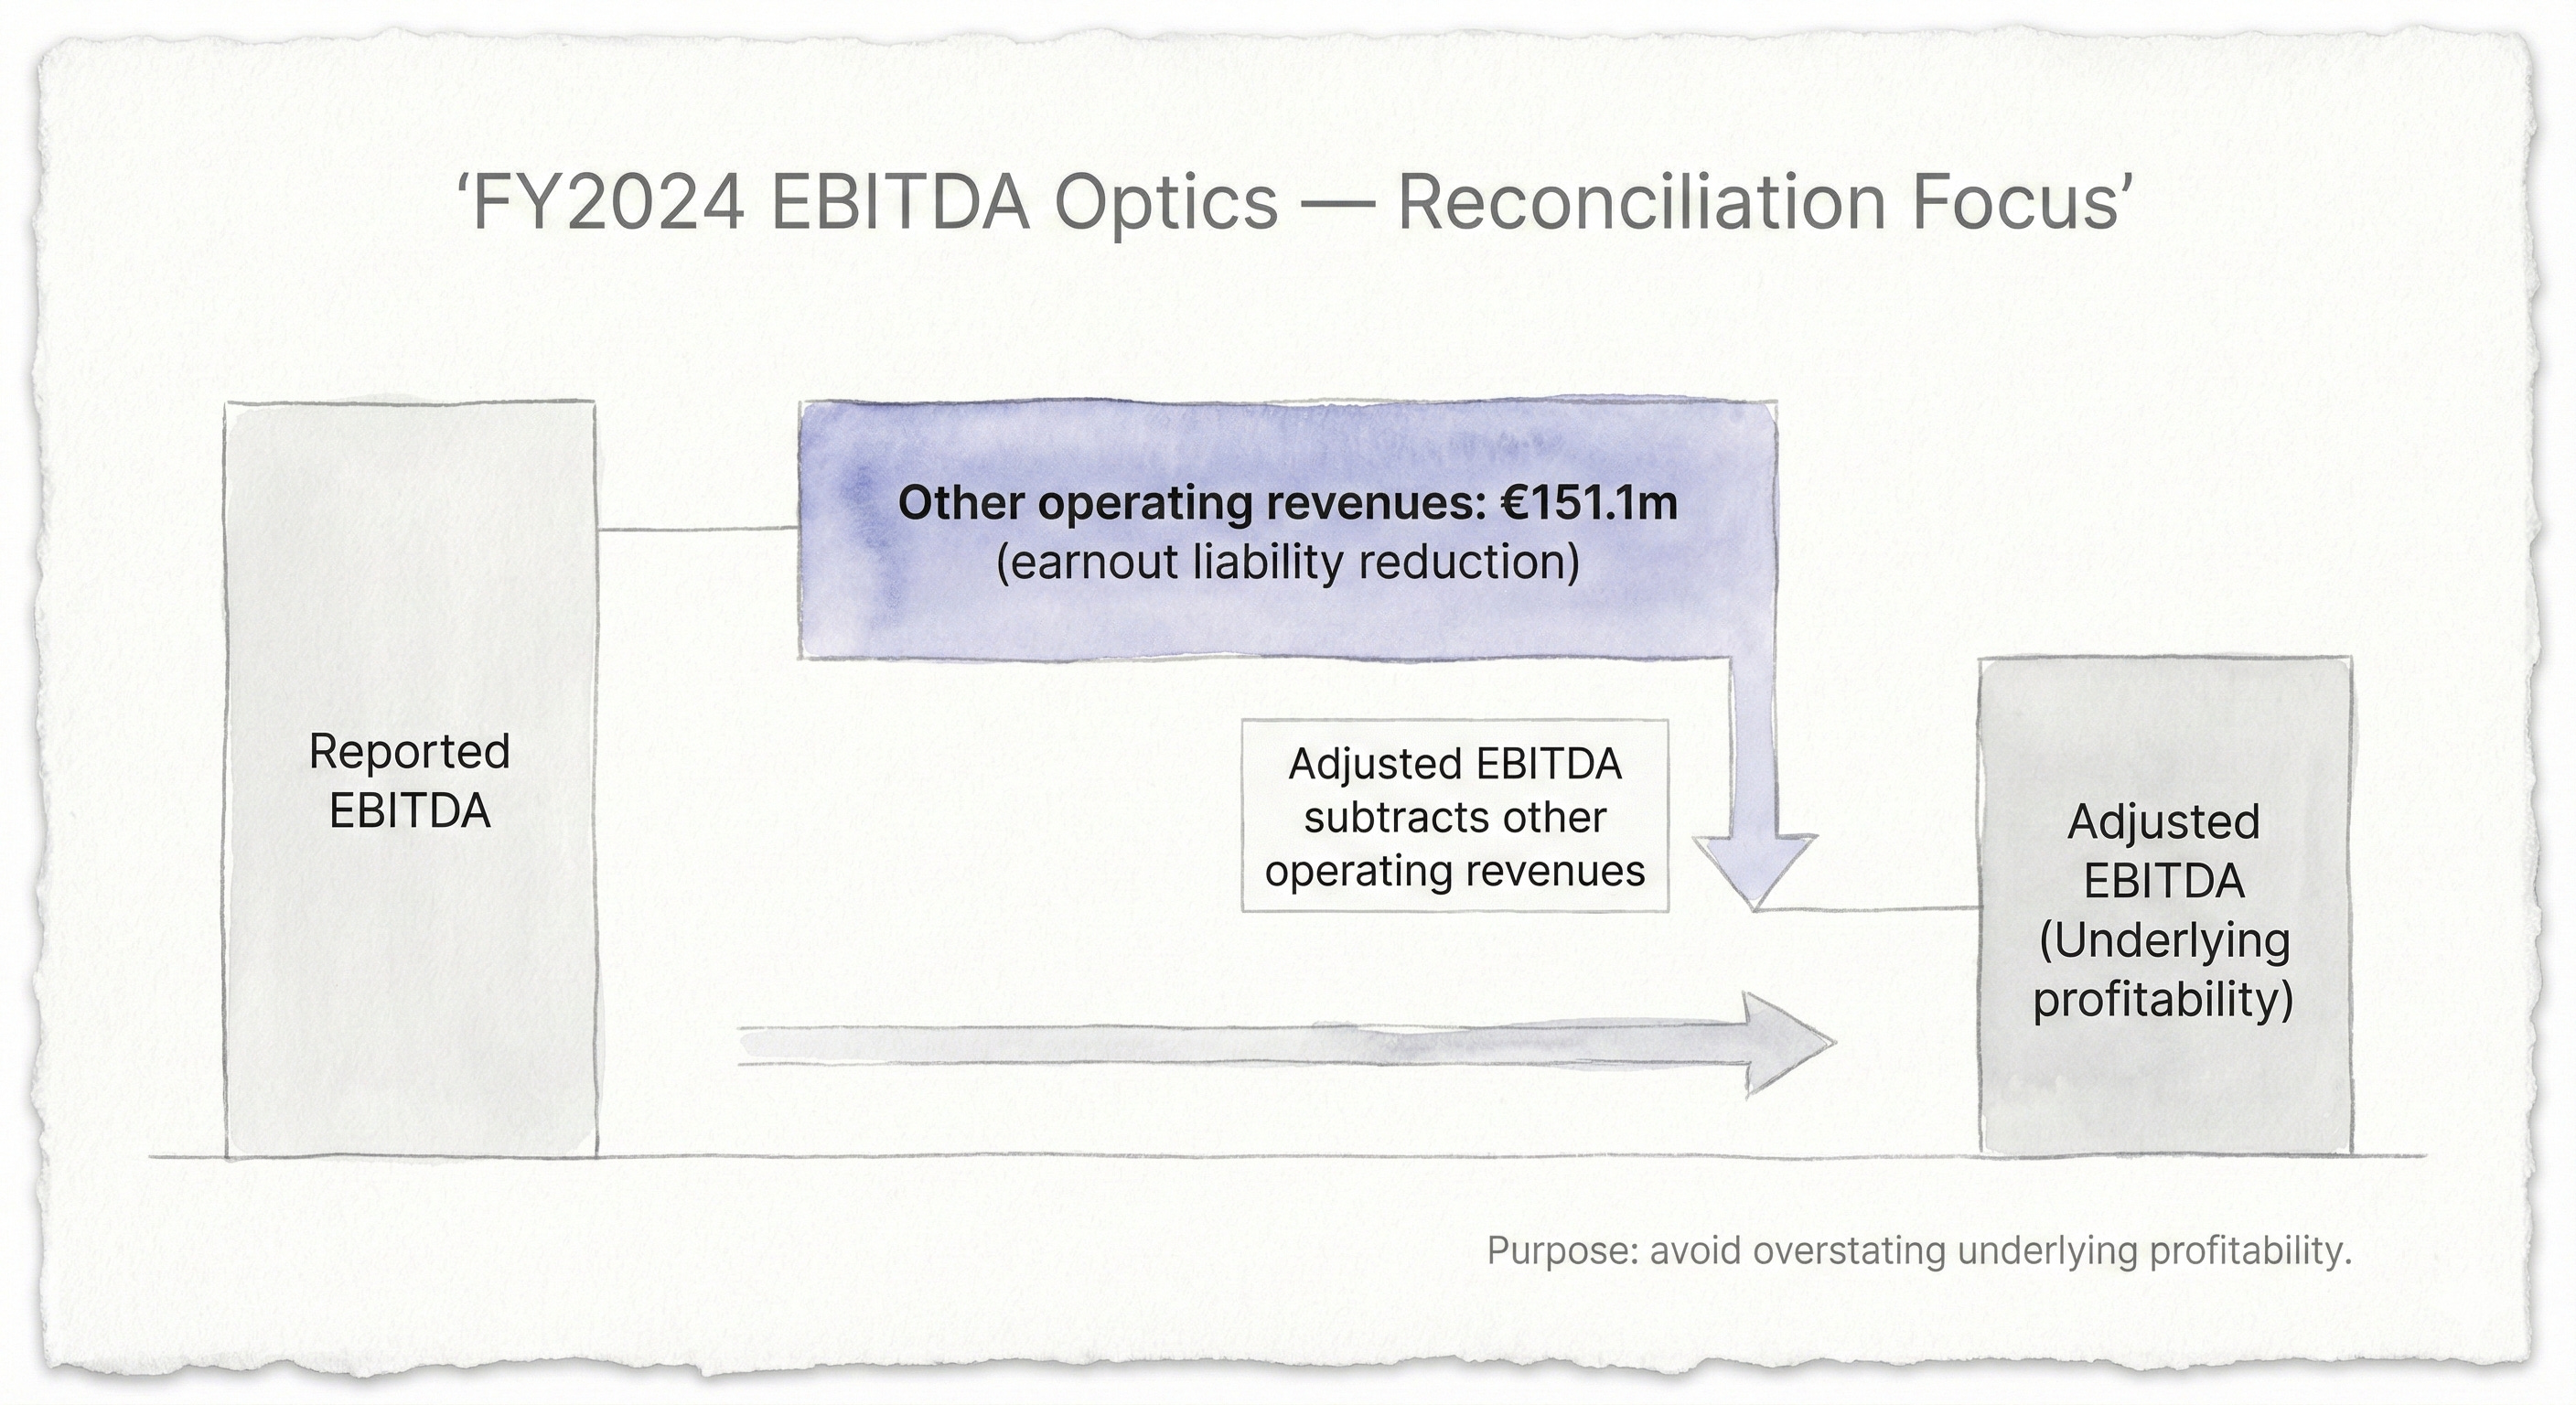
The Audit Note: FY2024 includes “other operating revenues” of €151.1m tied to a reduced earnout liability. The Adjusted EBITDA removes this. This is a reminder: “Headline profitability” can include accounting reversals. Always read the reconciliation.
Atomic Take: The fundamentals still glow. The only reason it’s not a perfect scorecard is the customer concentration plus the real-world operational combat.
Falsifier: If adjusted EBITDA margin (FY2024: 68.4%) compresses sharply without a clear mix or regulatory explanation, the “scalable infrastructure” claim is damaged.
THE STATEMENTS Q3 2025

BALANCE SHEET (THE GEIGER TEST)
As of 30 Sep 2025 (IFRS), Evolution reported:
Total Assets: €5,173.6m
Total Equity: €3,819.6m
Non-Current Liabilities: €150.9m
Current Liabilities: €1,203.1m
The big question isn’t “can they survive a storm?” They have a bunker. The question is “what do they do with their strength?” Capital allocation is now the main event.
The folks in the C-suite point to €759.6m of cash + bond portfolio as of 30 Sep 2025. This pile of money is clearly tied to shareholder distribution (dividends + buybacks).
Stop & Think: Buybacks are (often) a truth serum. They tell you what management thinks the business is worth.
As of 31 Dec 2024, Evolution held 5,270,961 own shares bought at an average of SEK 1,050.81. And in 2024, they repurchased shares at average prices of:
SEK 1,278.08 (Jan–Mar)
SEK 1,010.78 (Jul–Oct)
As I write this in January 2026, the share price (in Swedish krone) of Evolution is SEK 592.
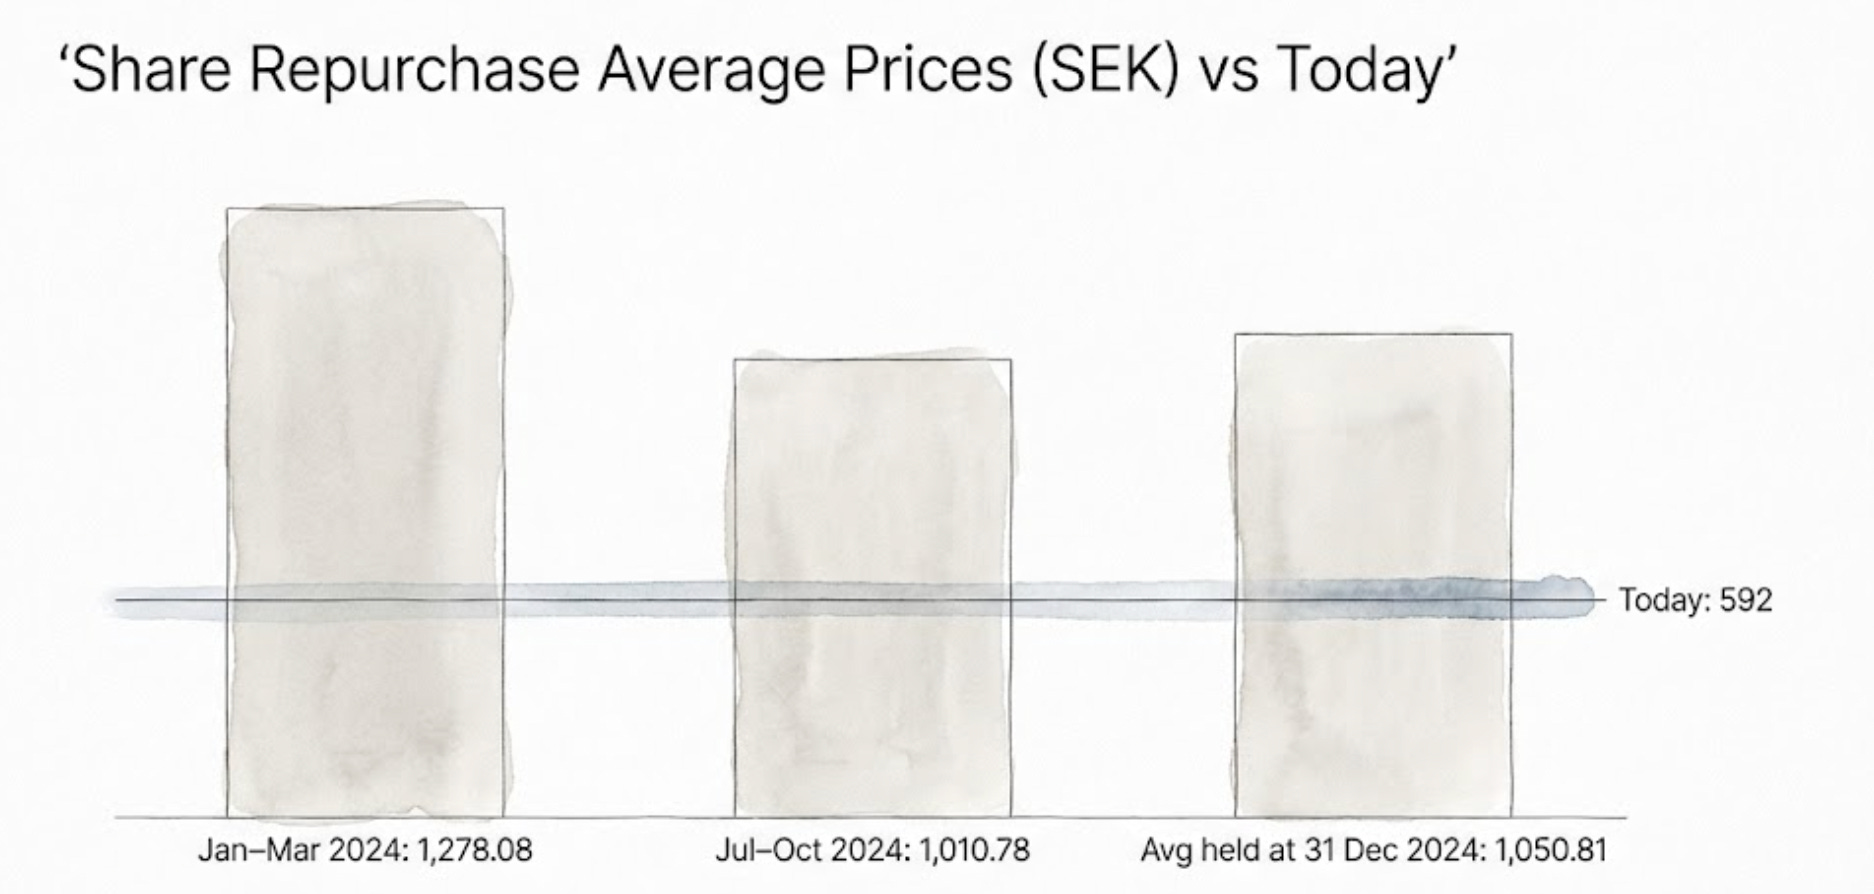
That gap is massive. It’s not a valuation conclusion by itself, but it is a factual reminder: Sentiment can change violently even when the business remains profitable. Management thought it was a steal at 1,000+. The market now hates it at 600.
Someone is wrong.
Atomic Take: Balance sheet strength is a feature, but the real “asset” here is optionality. They can defend the moat, reinvest in the business, and still return capital to you.
Falsifier: If cash + bond portfolio strength (as of 30 Sep 2025: €759.6m) trends down while capital returns remain high, without matching operating cash generation, then capital allocation becomes a risk, not a perk. You can’t pay dividends from a depleting savings account forever.
CASH FLOW (THE TURBINE)
In Q3 2025, the cash picture is clean in the way investors love: big cash generation, modest investment needs.
Total Investments: €29.8m into intangible and tangible assets.
Operating Cash Flow (after investments): €342.1m.
Cash Conversion: 83%.
This is the essence of Evolution. It can generate enormous cash while simultaneously being “high risk” in a different dimension. Financial leverage isn’t the boogeyman here. Regulation, reputation, and hackers are the boogeymen.
The Audit: Q3 2025 cash performance is strong, but a piece is explicitly working-capital timing (€35.2m contribution). If that reverses, cash can look worse next quarter even if the underlying business didn’t change.
Atomic Take: The turbine is still spinning, but read cash generation with the working-capital footnote stapled to your forehead.
Falsifier: If operating cash flow after investments falls materially from €342.1m (Q3 2025) while profit remains €252.3m (Q3 2025), it suggests cash leakage (capex, taxes, or working-capital drag) that changes the “cash machine” thesis.
INCOME STATEMENT (THE REACTOR)
Q3 2025 is the market’s most recent “temperature check,” and it’s running a little cold.
Net Revenues: €507.1m (IFRS), down 2.4% YoY and 3.3% QoQ.
Operating Profit: €296.6m.
Profit for the Period: €252.3m.
EPS: €1.25 (IFRS).
Adjusted EBITDA: €336.9m with a margin of 66.4%.
Zoom out a bit. FY2024 still demonstrates the business’s earnings power.
Profit for the Year: €1,244.0m (IFRS).
Effective Tax Rate: 13.5%.
So, the reactor is not “off.” It is not melting down. It’s just not accelerating right now—and the market pays a premium for acceleration, not maintenance.
Atomic Take: Evolution’s earnings power looks intact, but Q3 2025 tells you the trajectory is currently pointed down.
Falsifier: If net revenues re-accelerate to sustained positive YoY growth while margins stay around the 66–68% framework, the “growth is broken” narrative is falsified.
VALUATION
Let’s look at the price tag.
Current Price ($EVVTY): $64.69 per share. Market Cap: $12.9bn.
1. Earnings Yield (The Accounting Reality)
Trailing twelve-month “Profit to Equity holders” is €1,132.4m.
Against a market cap of ~$12.9bn, that is an earnings yield of ~10.6%.
2. Free Cash Flow Yield (The Cash Reality)
Trailing twelve-month “Free Cash Flow” is €1,141.7m.
Using the same market cap, that gives us an FCF yield of ~10.7%.
Stop & Think: Usually, accounting profit and free cash flow drift apart. Here, they are nearly identical. That is a sign of high-quality earnings. The cash is real.
3. The Sanity Check (Per Share)
TTM EPS €5.64 ≈ $6.80. EPS / Price = ~10.5% earnings yield.
TTM FCF per share ≈ €5.68 ≈ $6.85. FCF / Price = ~10.6% FCF yield.
The market isn’t arguing that Evolution is “low quality.” The market isn’t stupid. It sees the same margins we do.
What the market is doing is pricing in a persistent “Overhang Discount.” It is terrified of three things:
Operational disruption (sabotage/cyber).
Regulatory/compliance friction (the “sin tax”).
Trajectory risk (growth slowing down).
If those risks fade, a ~10–11% yield starts to look like a massive mispricing of durability. If those risks persist, the yield is a rational “stress premium.” You are getting paid extra to handle the headaches.
Atomic Take: At ~10.6% earnings yield and ~10.7% FCF yield (TTM), the stock is priced like a high-quality cash machine... but one with a non-trivial probability of permanent friction.
Falsifier: If TTM net profit and/or TTM FCF (through future quarters) materially decline from the €1.13bn / €1.14bn run-rate while management keeps presenting the issues as “temporary,” the “overhang discount” stops being a discount and becomes a warning label.
RISKS (THE MELTDOWN LIST)
I don’t like to sugarcoat risks. If you own a stock, you need to know what kills it.
The “Whale” Risk (Customer Concentration): The top customer was 13% of net revenues in 2024. The top five were 46%. That is not just “risk.” That is “one customer can ruin your quarter.” If a big operator switches suppliers, the stock takes a hit.
The War Zone (Operational Disruption): This isn’t theoretical. Management describes sabotage in Georgia and cyber-attacks targeting Asian operations. This impacted the second half of 2024 and is expected to slow growth for “some quarters ahead.” You can’t run a casino if the cameras are down.
The Permission Slip (Regulatory Risk): Evolution discusses licenses, compliance, and ring-fencing regulated markets. Failure here is existential. If you lose the license, you don’t have a business.
The Sin Bin (AML/Fraud): The annual report highlights exposure to sanctions, fines, and reputational damage. This is the “sin stock” tax. If they get caught in a money-laundering scandal, the multiple collapses.
The Taxman Cometh: Evolution flags Pillar II impacts and broader tax risks (including VAT). Uncertainty here is just another weight on the stock price.
The Sneaky Risk: People: In 2024, the Group averaged 20,973 employees. More than 85% of them are tied to operational gaming activity running 24/7. This is a labor-heavy tech company. Any staffing disruption—strikes, labor shortages, illness—becomes a throughput issue, not just a cost line.
Atomic Take: Evolution’s biggest risks are “license to operate” risks. You can’t spreadsheet your way out of reputational damage.
Falsifier: If regulated-market growth continues while margins stabilize (meaning the ring-fencing costs stop rising), the risk stack compresses meaningfully.
THE ATOMIC VERDICT
Status: Overhang-Heavy
Stars: ★★★★☆ (Business Quality) ★★★☆☆ (Current Clarity)
The case for “Still Exceptional” is not subtle. FY2024 showed extreme profitability: €2,214.1m total operating revenues and €1,419.6m EBIT (IFRS).
Even Q3 2025 showed a 66.4% adjusted EBITDA margin.
The case for “Still Messy” is also not subtle. Management describes disruption, sabotage, and cyber issues. Q3 2025 net revenues were €507.1m, down 2.4% YoY.
What Increases Confidence (Measurable):
Net revenues return to sustained positive YoY growth from the Q3 2025 base.
Asia stops being flagged as “volatile” in the outlook.
Operating cash remains strong without needing a working-capital tailwind (Q3 2025 WC contribution was €35.2m).
Upgrade Triggers:
Sustained positive YoY net revenues.
Operating cash flow after investments stays robust even as working capital becomes neutral.
Margin estimate 66–68% is reiterated without escalating caveats.
Downgrade Triggers:
Continued cyber language persists and growth stays negative.
Customer concentration worsens beyond the FY2024 baseline (13% top customer, 46% top five).
Effective tax rate rises further beyond 13.5% without offsetting growth.
Atomic Take: Evolution still looks like a compounding-quality business—but the overhangs are active enough that the signal isn’t clean.
FINAL WORD (FOR NOW)
Evolution is a Ferrari driving through a hailstorm. The engine is perfect (60%+ margins). The driver is skilled (founder-led culture). But the hail (cyber attacks, regulators, Asian volatility) is denting the bodywork.
If the storm passes, you have a Ferrari bought at a discount. If the storm is permanent climate change, you have expensive repairs forever.
Stop & Think: Do you believe the “Asian volatility” is a bad quarter, or a new reality? Your answer to that question determines your trade.
Is the “Sin Stock” discount worth it? Would you buy at SEK 600 knowing management bought at SEK 1,200? Let me know below.
References
Evolution AB (publ) — Interim Report January–September 2025 (presentation deck), dated 23 Oct 2025.
Evolution AB (publ) — Annual Report 2024.
Evolution AB (publ) — Press release: “Acquisitions of own shares in Evolution AB (publ)”, dated 15 Dec 2025.
Evolution AB (publ) — Share repurchase / buyback overview document (PDF)
Evolution AB (publ) — Financials workbook (Excel)
Disclaimer
This Deep Dive is an educational breakdown of a public company based on information available in the materials provided (e.g., annual/quarterly reports, investor presentations, earnings transcripts) and my interpretation of that information. It is designed to be a “bolt-on” intelligence layer to your own due diligence — not a replacement for it.
Independence: I do not accept compensation of any kind from the companies discussed. My research is driven solely by my personal search for high-quality compounders.
Skin in the Game: Unless otherwise stated, assume the author may hold a long position in securities mentioned. Any position creates bias — treat this as commentary, not gospel.
Not Financial Advice: Nothing here is investment advice, a recommendation, or a solicitation. I am not a financial advisor. You are responsible for your own decisions. The stars rating is not a buy recommendation, but meant as a guide to understand the quality of the financial statement of the respective companies.
Error & Update Risk: Financial statements change, companies restate, guidance evolves, and I can be wrong. Verify key figures in the primary filings and consider reading the footnotes before deploying capital.