

Deep Dive: MercadoLibre ($MELI)
There are businesses you trade and businesses you live with; MercadoLibre is trying to be the latter, which is why the quarter-to-quarter commentary always misses the plot.


New to The Atomic Moat? This analysis of MercadoLibre ($MELI) is a prime example of how we dissect high-quality compounders. If you want these deep dives sent to your inbox, join 900+ other investors below.
The 30-Second Elevator Pitch
What They Actually Do
Think of MercadoLibre as the central nervous system for Latin American commerce. They aren’t just selling stuff. They run the marketplace, the trucks delivering the boxes, the ads you see, the payments for the goods, and the credit card you swipe to buy them. They’re trying to spin all those plates at once into one giant, compounding flywheel.
The Headache (The Challenges)
Now, the results are real, but looking at them can be messy.
Margin Squeeze: They’re offering free shipping like it’s going out of style, which hurts profits in the short run.
The Banker’s Worry: Their credit business is growing fast, which always makes Wall Street whisper, “What happens if people stop paying?”
The Argentina Factor: It adds a layer of what I call “accounting radiation”—hyperinflation math and currency noise that makes the spreadsheets look radioactive.
The Fix The solution is simple but hard: Keep the volume pedal to the floor while keeping the loans boring and the trucks full. If logistics get cheaper per package, the math works. Basically, keep the flywheel spinning without the loan book turning into a horror movie.
My Position: High Conviction. But let’s be honest, it’s heavy on the “overhang” if the credit quality slips or Argentina acts up.
The Setup: Q3 2025

MercadoLibre’s message for Q3 2025 wasn’t exactly a whisper. It was a shout: The machine is accelerating again.
Let’s look at the scoreboard:
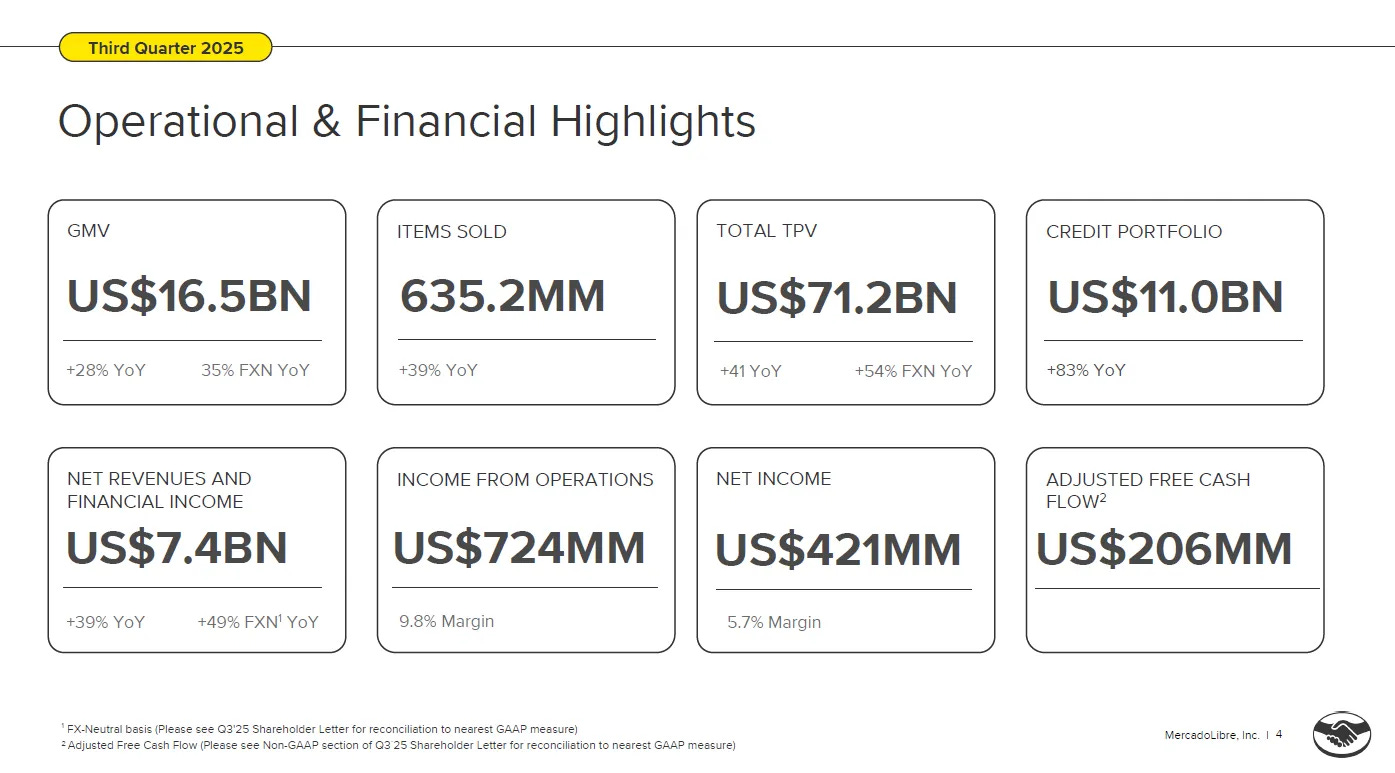
Net Revenues & Financial Income: $7,409m
Income from Operations: $724m (That’s a 9.8% operating margin).
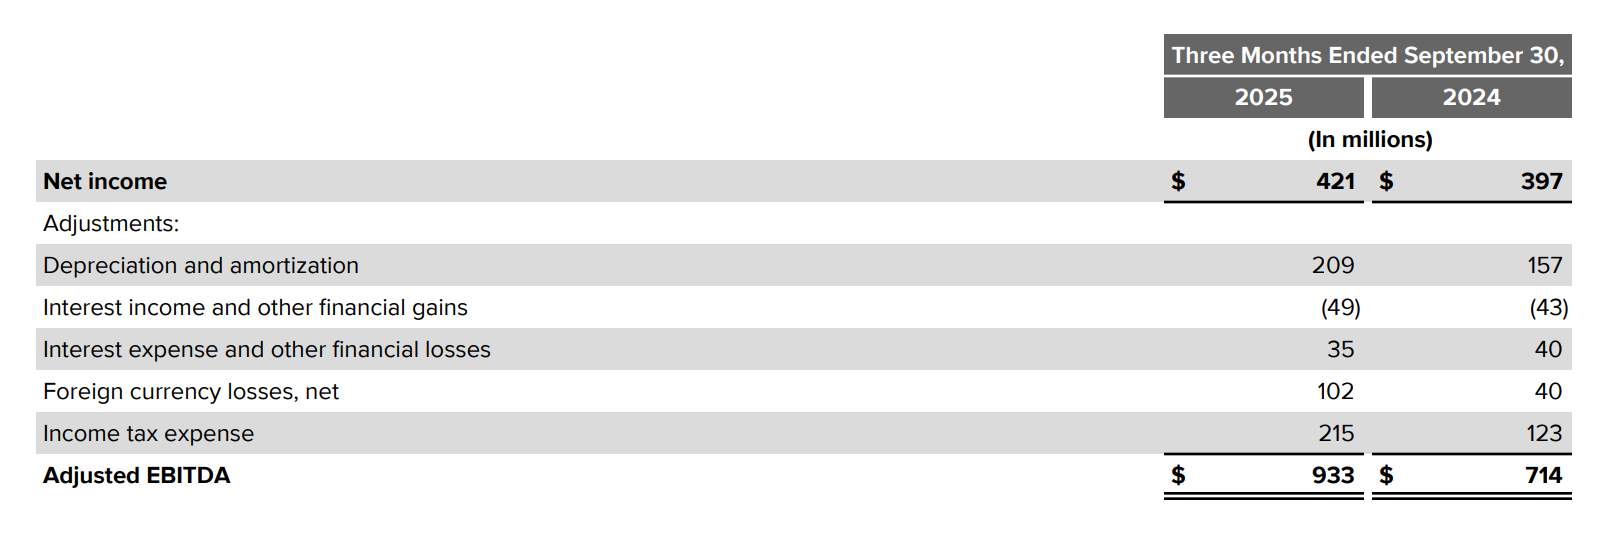
Net Income: $421m (That’s a 5.7% net income margin).
Why is this happening now? Three dials are turning to the right at the same time:
Commerce: People are buying more stuff. GMV hits $16.5bn.
Fintech: Money is moving faster. TPV hits $71.2bn.
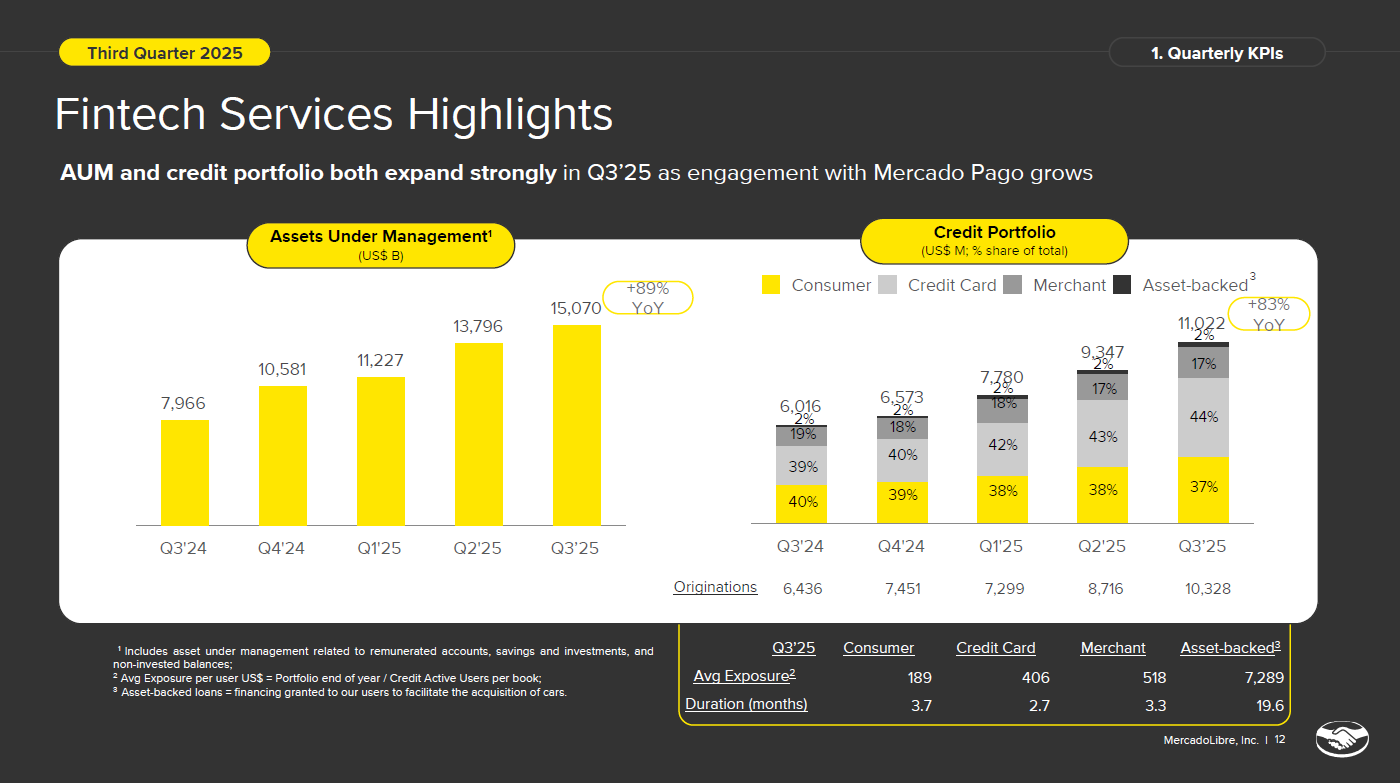
Credit: The loan book is getting thicker. Credit portfolio hits $11.0bn.
The Market’s Argument
The market isn’t arguing about whether this is a good business. Everyone knows it is. The argument is: “What kind of risk is this?” If you’re just a platform connecting buyers and sellers, you get one price tag. If you’re a platform plus a lender, you get a cheaper one.
Atomic Take: Q3 2025 looks like great execution on the ground, but the stock’s story is still stuck in the “Credit + Argentina + Optics” narrative.
The Falsifier (How we know I’m wrong): If Consolidated Net Revenues & Financial Income growth falls below 30% YoY for two quarters in a row, the thesis is broken. (Metric: Company-reported YoY % on the same line item).
How This Business Actually Makes Money
I like to think of MercadoLibre as a two-core reactor with a “third rail” that powers the whole grid.
Core 1: Commerce (The Marketplace + Logistics + Ads).
Core 2: Fintech (Mercado Pago payments, acquiring, + Credit).
The Third Rail: Integration. Each part exists to make the other part necessary.
The Logistics Gamble
On the commerce side, management is willing to “spend” money on shipping to make the market bigger. It’s counter-intuitive, but effective. They accelerated growth “despite a major increase in free shipping and lower seller shipping charges, which reduced shipping revenue” (Source: Q3 2025 shareholder letter).
Stop and think for a second. Most companies try to charge you more for shipping to pad the bottom line. MELI is charging less. Why?
This isn’t an accident. It’s a strategic knob they are turning. Lots of companies talk about “ecosystems” like it’s a buzzword. MELI actually pays for theirs. That free shipping isn’t a promotion or a coupon; it’s Capex in disguise. Except instead of building a factory, they are building a habit. The question isn’t “Did it hurt margins this quarter?” The question is “Did it make MercadoLibre the default choice for a family in Brazil?”
The Brazil Case Study
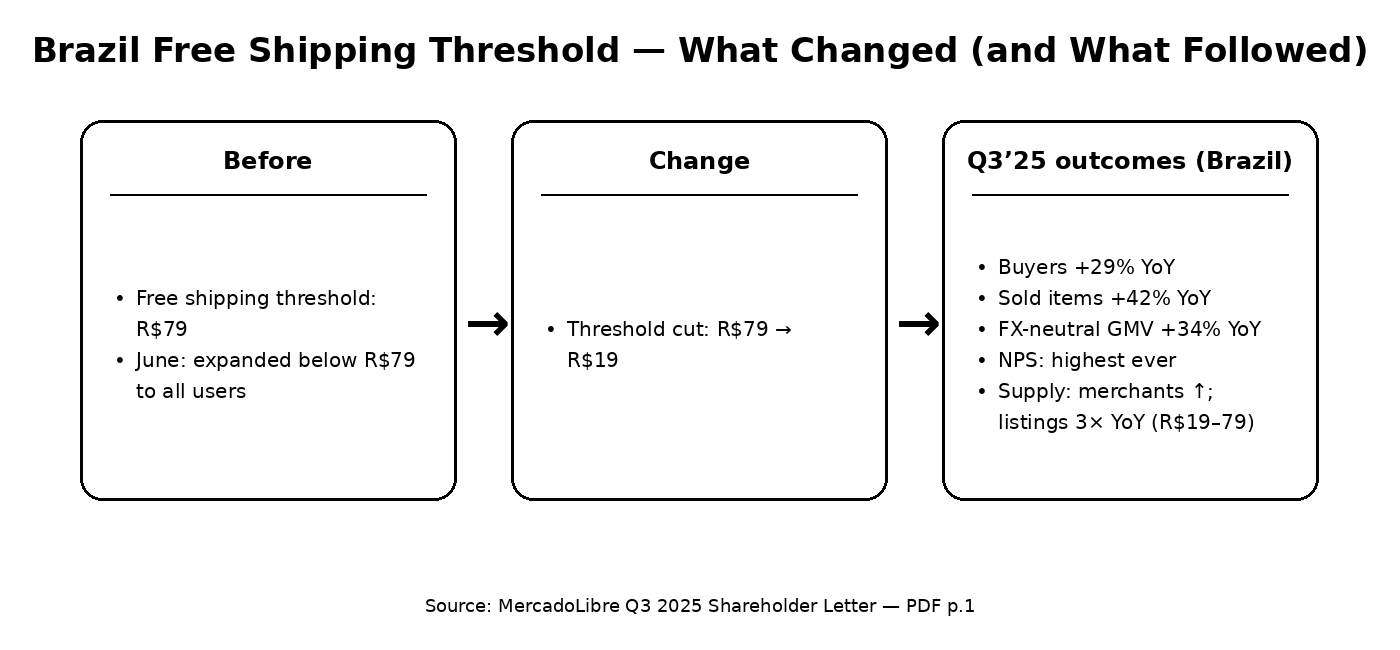
Brazil is the cleanest example of this. Management highlighted reducing the free shipping threshold from R$79 to R$19. That is a massive drop. Here is what you hope happens next (and what they say happened):
Conversion rates went up.
Retention went up.
Suppliers started adding more cheap items (the newly subsidized band).
The network swallowed the higher volume without breaking a sweat.

This is what the textbooks call “Scale Economies Shared.” If the cost to ship a box keeps falling, MELI can subsidize the customer with efficiency rather than desperation. That’s the kind of reinvestment that compounds your money.
The Fintech Moat
Now, here is the part that makes this model hard to copy. Fintech isn’t just a “feature” like a checkout button. It’s a distribution engine.
Payments increase how often you use the app (stickiness).
Commerce gives them high-intent customers.
The Data improves the risk models because they know if you buy diapers or video games.
Credit gets underwritten based on your behavior in the ecosystem, not just a cold credit score from a bank.
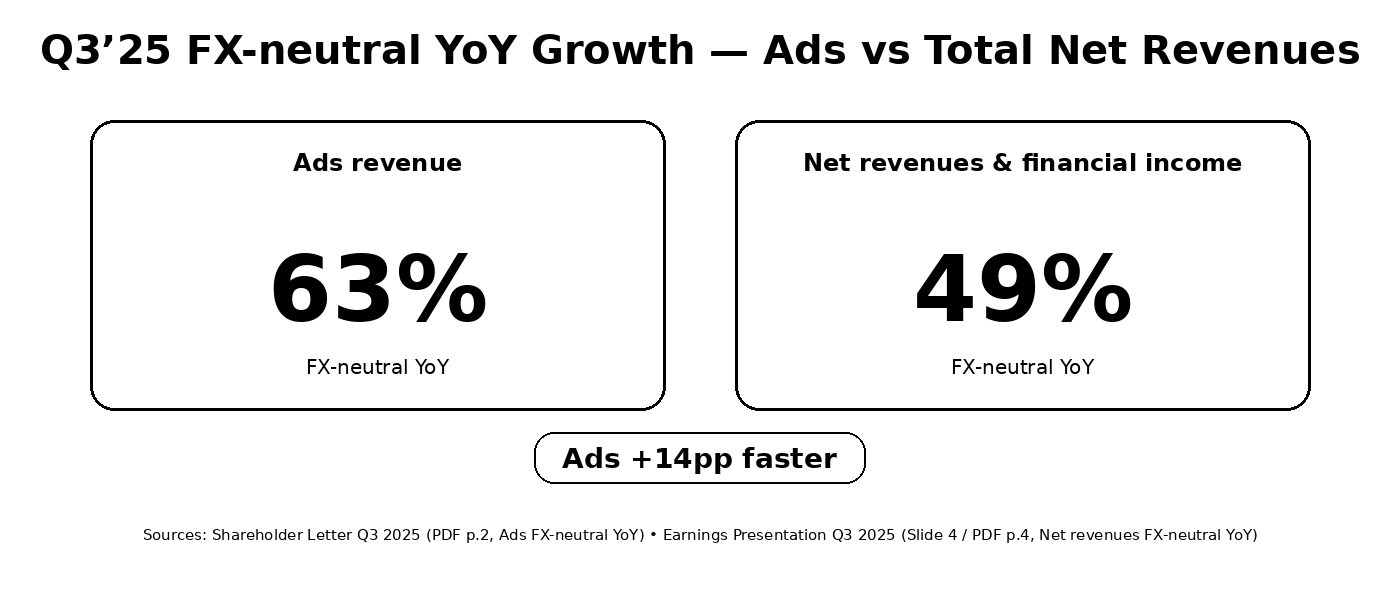
The Margin Booster: Ads
Ads are the “third rail” for margins because they monetize the customer’s intent without having to jack up the fees on merchants. The company says FX-neutral ads growth accelerated to 63% YoY (and 56% in USD). Think about that. The ads business is growing faster than the company itself. This is the “Nomad Playbook” in a trench coat:
Share the savings (cheaper shipping) with the customer.
Pull demand forward.
Let the density of orders make the next shipment cheaper.
Use high-margin Ads revenue to pay for the party.
If that loop holds, the short-term margin drama is just the price of admission.
A Note on “Greed”
Importantly, the marketplace is not monetizing by force. The 3P take rate is shown at 21.1%, slightly down YoY. The signal here? They are trying to compound the density of the ecosystem and then make money on services (logistics, ads, fintech), not just by squeezing fees out of sellers.
Atomic Take: MELI’s moat is the sheer cost of recreating this integrated mess. Scale is their weapon, but coordination is the trap.
The Falsifier: If the 3P take rate declines >100 bps YoY while GMV fails to re-accelerate, we have a problem. (Metrics: take rate % and GMV YoY % as presented by the company).
What Went Wrong (Or: Why the Paint Looks Scratched)
First off, let’s be clear: when I say “wrong,” I don’t mean “the engine fell out.” I mean “optically unpleasant choices.”
The Self-Inflicted Punch The biggest bruise on the quarter was a choice they made on purpose: a deliberate shift toward more generous shipping terms that reduced shipping revenue.
I follow what I call the “Nomad Playbook.” Investing in these types of companies is basically a character test. Can you sit there and watch a great operator choose messy reinvestment over a tidy quarterly PowerPoint? Can you resist the urge to demand cosmetic profitability just to make yourself feel better?
MELI keeps choosing the mess. And folks, that is a feature, not a bug—at least until the flywheel stops paying it back. They are taking near-term pain in exchange for higher conversion, retention, and a healthier marketplace.
The Scary Line Item Second, scaling credit forces the provision line into the spotlight. Provision for doubtful accounts was $815m.
In isolation, that number is meaningless. But in context, alongside rapid portfolio growth, it becomes the line item investors use as a lie detector. It’s the one number that can flip a “Great Platform Story” into a “Risky Lender Story” overnight if it spikes unexpectedly.
The Microwave Effect Third, Argentina makes the P&L look like it’s been left too close to a microwave. Management spends a lot of time describing Argentina’s hyperinflationary accounting impact and how FX revaluations flow through the income statement. The deck shows Foreign currency losses, net as $102m.
Stop and Think: The temptation here is to treat “shipping margin pressure” and “Argentina noise” as operational failures. They aren’t. In the company’s own framing, these are trade-offs and accounting mechanics layered on top of a still-expanding ecosystem.
Atomic Take: The “hate” is partly self-inflicted. MELI keeps choosing flywheel health over tidy quarterly optics, so the story stays noisy by design.
The Falsifier: If the company’s operating margin (company-defined) falls below 8% while logistics efficiency stops improving, we have a problem. (Watch: unit shipping cost trends the company highlights).
The Catalysts: How We Keep Score
MercadoLibre is great because they don’t hide the gauges. The catalysts here are unusually testable.
Catalyst #1: Logistics Efficiency (The Fulcrum)
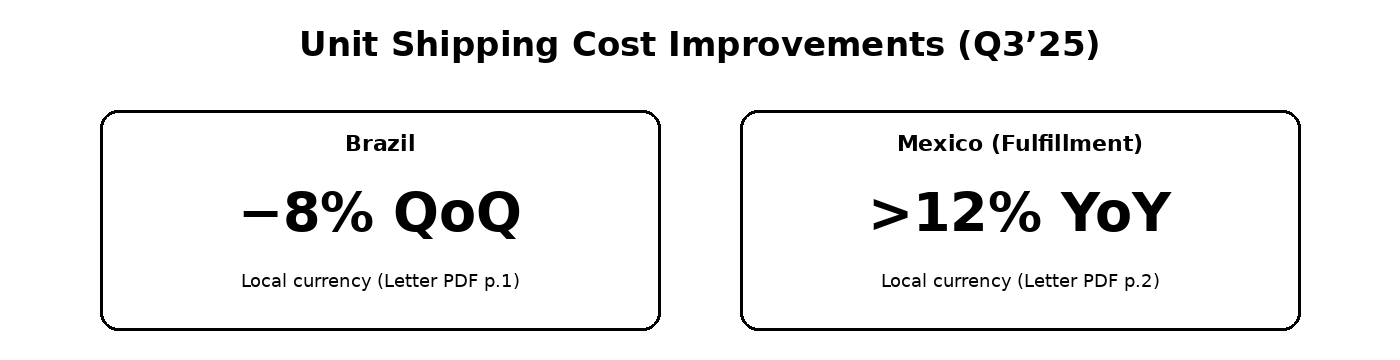
The shareholder letter reports unit shipping costs in Brazil down 8% QoQ and Mexico fulfillment unit shipping cost at a record low, down >12% YoY.
This is the hinge the whole thesis swings on. If shipping gets cheaper per unit, the same subsidy buys you more demand without permanently poisoning your margin. Watch this like a hawk. If those trends persist, free shipping shifts from a “margin crime” to a “competitive weapon.”
Atomic Take: This is the compounding fulcrum. If unit shipping costs keep falling while free shipping expands, MELI is literally buying growth with efficiency rather than with brute-force subsidies. That’s the “scale economies shared” test in one line.
Catalyst #2: The Brazil “Sticky” Test
Management frames Brazil as having record buyer additions after the threshold reduction. They also highlight the supply response—more merchants selling and more listings in the newly subsidized price band. This is the “did the subsidy buy durable engagement?” test. If it did, the marketplace becomes harder to dislodge.
Catalyst #3: Ads as the Margin Balancer FX-neutral ads growth accelerated to 63% YoY (Q3 2025, %, FX-neutral). Ads are attractive here because they monetize intent (I want to buy shoes) without needing to squeeze the take rate (charging the seller more fees). This revenue stream helps fund the shipping generosity without fully sacrificing profitability.
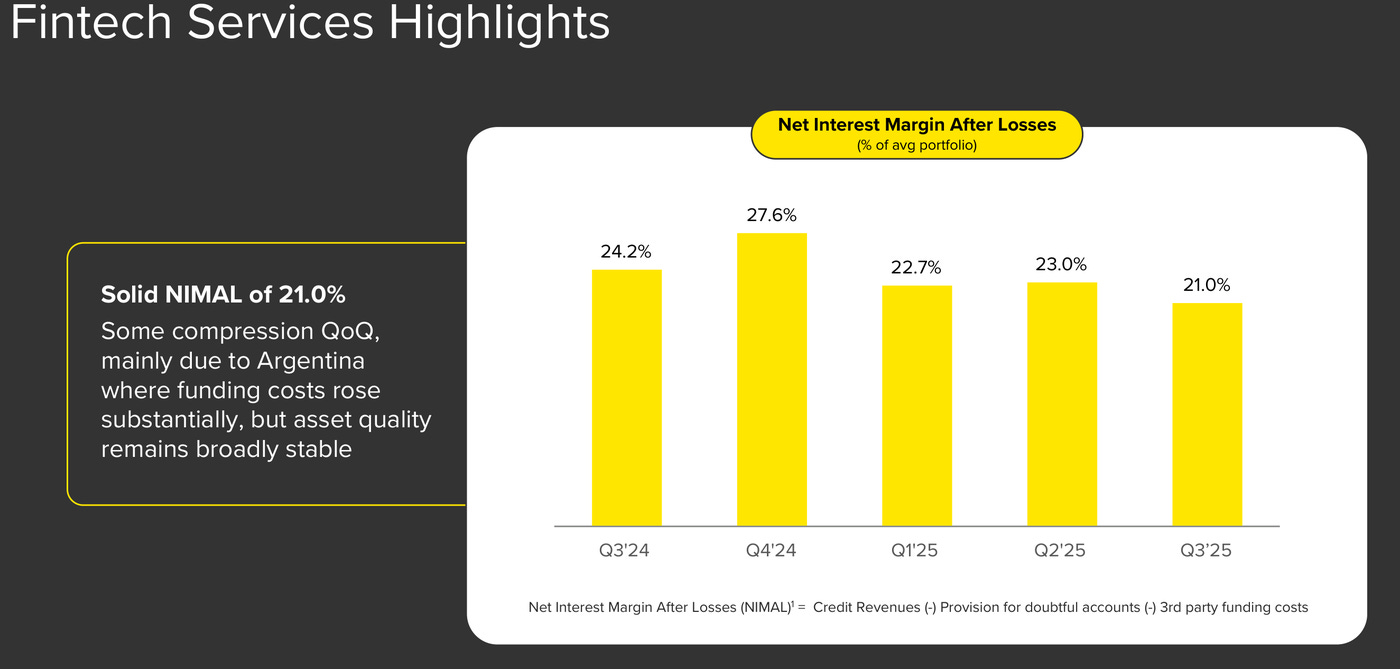
Catalyst #4: Credit Scales (But stays boring) The company reports 15–90 day NPL (Non-Performing Loans) at 6.8% and NIMAL at 21.0%. They attribute sequential pressure mainly to Argentina funding costs while describing asset quality as broadly stable.
Here is the translation:
NIMAL (Net Interest Margin After Losses): This is the “Are we being paid enough to take this risk?” gauge.
The Fact: Credit portfolio growth is rapid.
The Hypothesis: Credit cards move from “investment phase” to “harvest phase” as cohorts mature—if underwriting discipline holds.
Atomic Take: The catalysts are already visible on management’s own scoreboard: logistics costs down, ads up, and credit scaling without obvious quality deterioration.
The Falsifier: If Ads growth decelerates sharply while logistics costs stop improving and operating margin fails to recover, the machine is broken. (Metrics: FX-neutral ads YoY %, unit shipping cost trend, operating margin).
Financial Quality Rubric (The Report Card)
Scale + Growth Durability: 5/5
Net revenues & financial income: $7,409m Atomic Take: MELI still behaves like a company running at expansion velocity, not “mature platform” velocity.
Profitability Under Reinvestment: 4/5
Company presents 9.8% operating margin alongside ongoing investment. Atomic Take: Being profitable while aggressively reinvesting is a rare combo—until it isn’t.
Cash Generation Quality: 3/5
Net cash provided by operating activities: $6,907m
The Audit: We need to label the “CFO strength” correctly. In the same period, funds payable to customers increased (that’s a float mechanic, like a bank holding deposits) while loans receivable expanded materially (cash absorbed to grow credit). Treating “Cash Flow from Operations” as pure earnings power is how you get irradiated by a payments balance sheet.
Balance Sheet Simplicity: 3/5
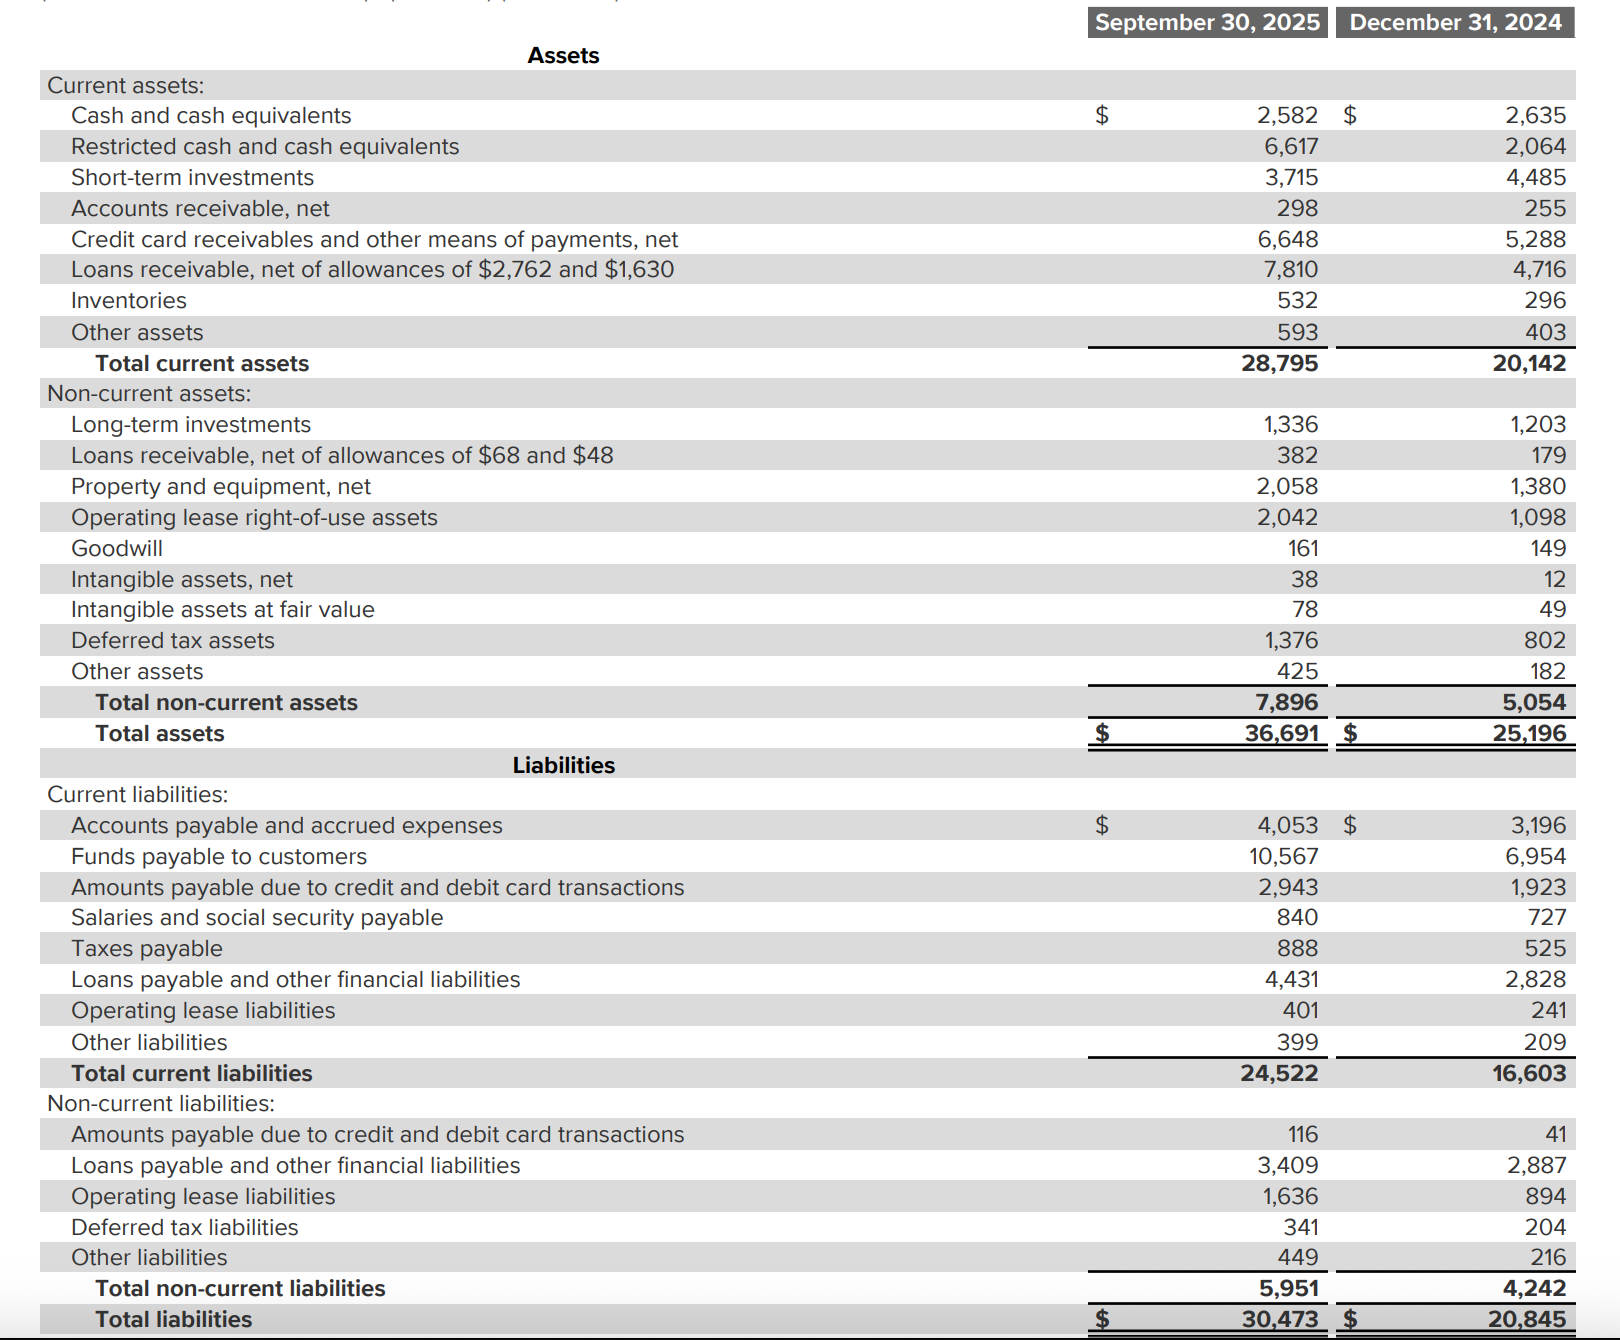
Cash & cash equivalents: $2,582m
Restricted cash: $6,617m
Funds payable to customers: $10,567m. (Q3 2025 earnings presentation financial statements) Atomic Take: The liquidity looks huge until you read the labels. A lot of that cash belongs to their customers, not them.
Credit Discipline Risk: 3/5
Credit portfolio: $11.0bn
15–90 day NPL: 6.8%
NIMAL: 21.0% Atomic Take: Great when it’s boring; brutal when it’s not.
Accounting / Macro Optics: 3/5
Argentina hyperinflation discussion + FX losses disclosed. Atomic Take: The business can be executing perfectly while the reported GAAP optics look chaotic—especially in Argentina.
Final Verdict: MELI looks like a high-quality compounder with a single persistent failure mode: Credit + Macro Optics can flip the narrative faster than operations can respond.
The Falsifier: If Provisions continue rising faster than net revenues & financial income over multiple quarters, get worried. (Watch the GAAP provision line versus the GAAP revenue line).
The Statements: Lifting the Hood
Balance Sheet (The Geiger Test)
Start with the adult question: what’s liquid, and what’s plumbing?
The Q3 2025 report shows cash and restricted cash that are massive in absolute terms. But look closely at the labels. You see large obligations tied to customer funds. This is normal for a scaled fintech operation. It’s like a bank vault—just because the money is in the building doesn’t mean the teller can take it to Las Vegas.
Cash & cash equivalents: $2,582m (This is the company’s wallet).
Restricted cash: $6,617m (This is often regulatory).
Funds payable to customers: $10,567m (This is someone else’s money).
The Audit: If you talk about MELI’s balance sheet like it’s a retailer’s balance sheet, you’ll misread the risk. A meaningful portion of this is payments infrastructure, not discretionary liquidity. What’s not normal is pretending it’s all “excess cash.”
Atomic Take: The balance sheet is strong in scale but not simple. Liquidity analysis must separate “available” from “restricted/owed.”
The Falsifier: If Net debt rises while operating margin compresses, the plumbing is leaking. (Metrics: net debt as presented by the company; operating margin).
Cash Flow (The Turbine)
Repeat after me: Net income is not cash. And fintech cash is not “just operating cash.”
The company reports net cash provided by operating activities of $6,907m. That number looks like a winning lottery ticket. But wait. In the same period, they report Capex-like investment (PPE + intangibles) of $(916)m.
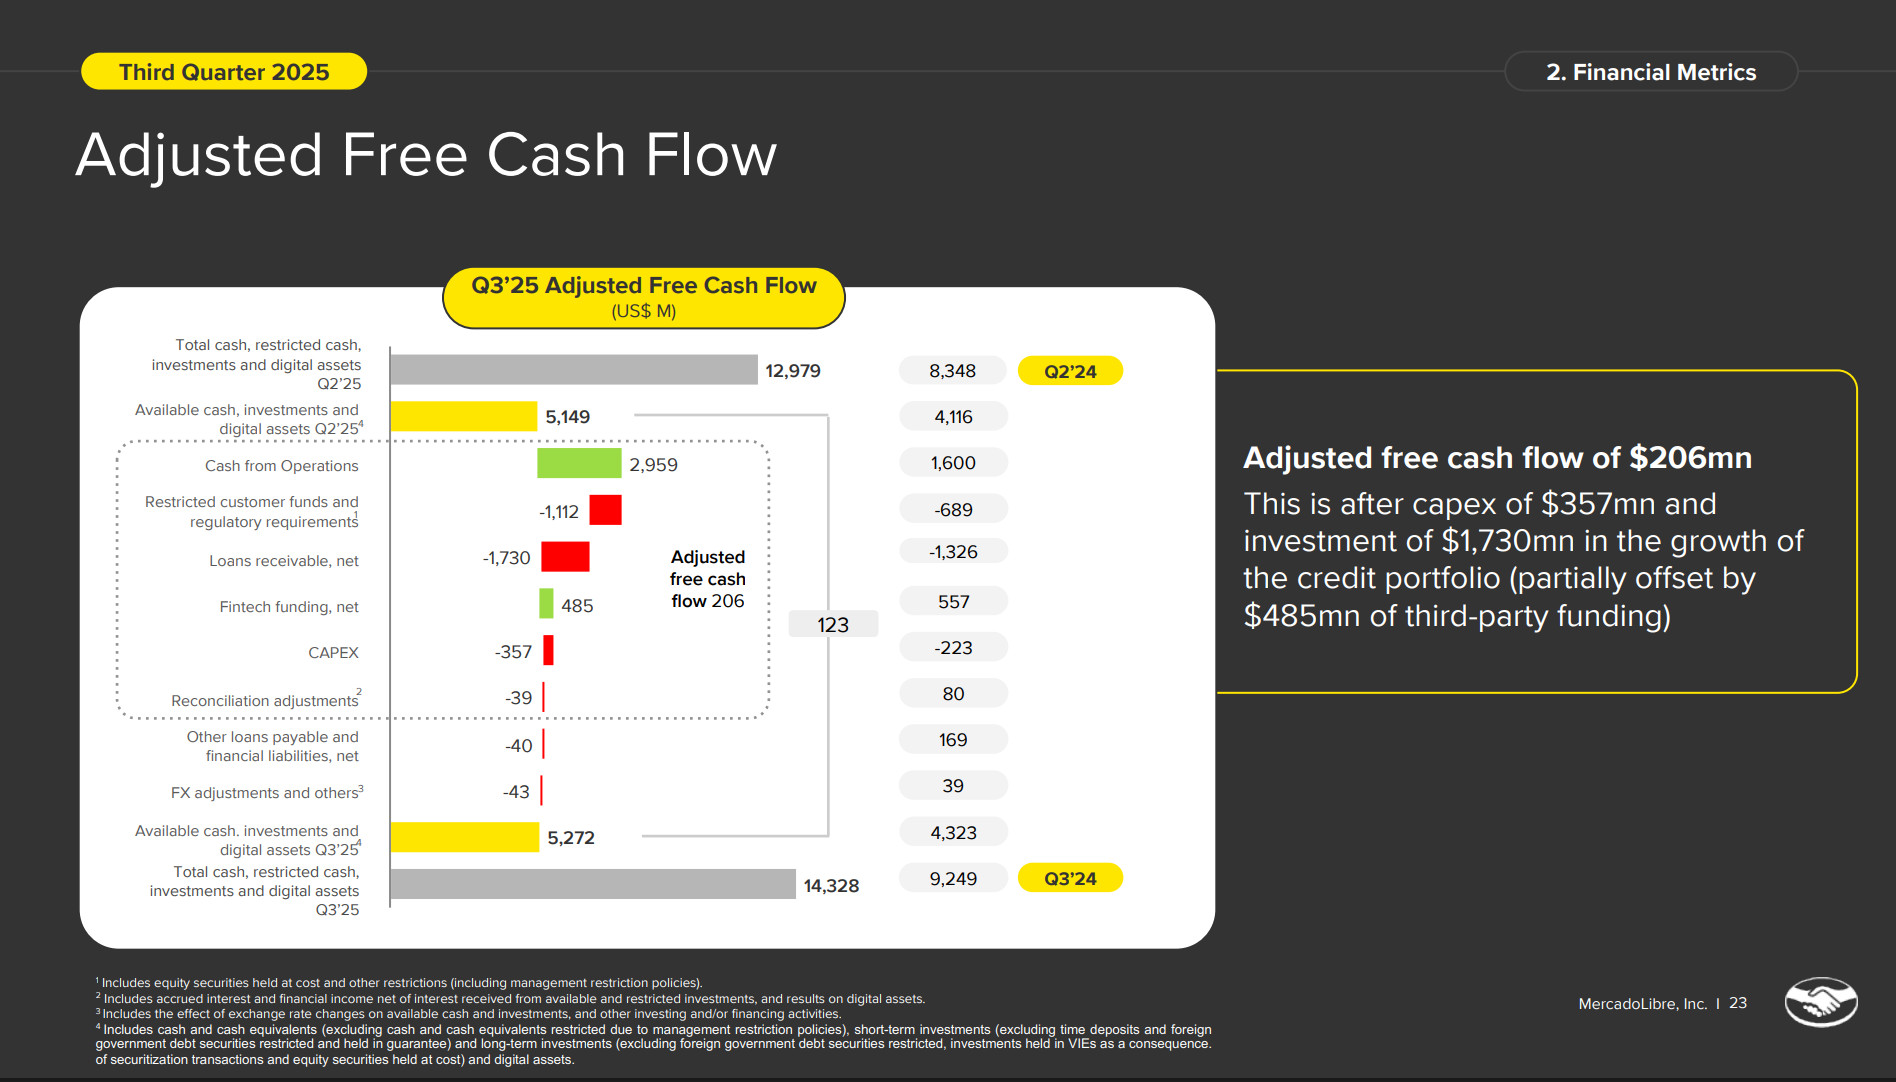
So, what is the real number? Management points to Adjusted Free Cash Flow of $718m. Why the huge gap between $6.9bn and $718m? Adjustments. They have to back out the mechanics of customer-fund restrictions, loans receivable changes, and working-capital debt mechanics.
Stop and Think: This is why MELI cash flow debates never die. The GAAP CFO can look spectacular because of “float” (holding customer money), while the economic reality depends on how much cash is being sucked up by growing the loan book.
The Audit: The solution isn’t cynicism, it’s labeling. MELI’s cash generation is real, but you have to acknowledge the float mechanics and the cash absorbed by credit growth.
The Falsifier: If CFO remains elevated while the drivers tied to customer funds flatten or reverse—and credit cash absorption remains high—the turbine is stalling. (Watch: company’s disclosed cash flow line items).
Income Statement (The Reactor)
The P&L tells you two truths at once:
The model works at scale: Revenue base and operating profit exist in the same sentence.
The trade-off: Management is actively trading away some “pretty” revenue (shipping fees) to expand engagement and volume.
Plus, the accounting noise (especially Argentina) can distort readability, making the P&L look like a seismograph during an earthquake.
Atomic Take: The income statement is strong enough to fund reinvestment, but noisy enough to keep the valuation debate permanently active.
The Falsifier: If Gross profit growth lags net revenues & financial income growth for multiple quarters, the pricing power is eroding. (GAAP-to-GAAP comparison).
Valuation: The Price of Admission
Valuation here is mostly a bet on duration, not a bet on a single quarter.
The current market cap is around $102bn. Let’s do the napkin math on Q3’25 GAAP net income annualized ($421m × 4):
~61× Q3’25 net income run-rate P/E. (This differs from TTM/forward P/E).
~35× annualized Q3’25 GAAP operating income ($724m × 4).
Expensive? In isolation, absolutely. But this is the cost of entry for a dominant compounder. The market is effectively betting that today’s “expensive” is tomorrow’s bargain, provided the three engines (shipping efficiency, ad monetization, and credit quality) keep firing in sync.
Atomic Take: This is Nomad math: the multiple only works if the flywheel’s lifespan is long.
The Falsifier: If credit quality trends deteriorate while growth stays aggressive (e.g., 15–90 day NPL 6.8% moves materially higher and stays there), the market’s “duration bet” gets repriced fast.
The Atomic Verdict
Disclosure: I’m not a neutral observer here. MercadoLibre is the largest position in my Atomic portfolio.
Status: High Conviction (with caveats). Rating: 4.0 / 5.0 stars.
Reason #1: The flywheel is visibly accelerating. The company discloses TPV $71.2bn and GMV $16.5bn. More impressively, it reports net income of $421m even while leaning into free shipping and credit expansion.
Reason #2: Operating system improvements are tangible. The company highlights unit shipping cost improvements in Brazil and Mexico. This is exactly what you want to see if you’re subsidizing shipping as a growth lever.
Reason #3: Credit quality isn’t flashing red—yet. The company discloses 15–90 day NPL at 6.8% and NIMAL at 21.0% while scaling the portfolio.
What would increase confidence? I want to see a longer track record of credit scaling without deterioration in NPL/provisions while logistics efficiency keeps compounding. Basically, prove you can run the reactor hotter without stressing the containment vessel.
The market cap is the market’s confidence score. At ~$102bn, the market is underwriting durability, not just growth. The only acceptable way to earn that is: shipping efficiency keeps improving, ads stay strong, and credit stays boring.
Upgrade Triggers
NIMAL stabilizes/improves while the credit portfolio continues scaling (metrics: NIMAL; portfolio size).
Operating margin expands from the company’s Q3 2025 level while the free shipping strategy persists (metrics: operating margin; continued strategy emphasis in materials).
Ads growth remains elevated on an FX-neutral basis (metric: FX-neutral ads YoY %).
Downgrade Triggers
NPL rises materially above the company’s Q3 2025 level and/or provisions accelerate (metrics: NPL; GAAP provision line).
Unit shipping cost improvements stall or reverse (metrics: Brazil/Mexico unit shipping cost trends highlighted by the company).
Balance-sheet leverage expands without margin support (metrics: net debt as presented; operating margin).
Atomic Take: MELI is a compounding machine that keeps choosing to stay aggressive. The only rational way to underwrite the story is to watch whether credit and Argentina ever force the reactor to throttle down.
Call to Action
I want to hear from you: Does the $11bn credit portfolio scare you, or do you trust the data advantage? Drop a comment below.
Reference Notes
Q3’25 one-slide scoreboard (Net revenues & financial income $7.4bn; operating income $724m / 9.8% margin; net income $421m / 5.7% margin; GMV $16.5bn; TPV $71.2bn; credit portfolio $11.0bn): Earnings Presentation Q3 2025, Slide 4 (PDF p.4).
“Growth accelerated… despite a major increase in free shipping and lower seller shipping charges, which reduced shipping revenue.” (plus the consolidated headline results paragraph): Shareholder Letter Q3 2025, PDF p.4.
Brazil free-shipping threshold move (R$79 → R$19) + management-described outcomes (buyers/supply response/NPS framing): Shareholder Letter Q3 2025, PDF p.1.
Ads growth (FX-neutral Ads revenue growth accelerating to 63% YoY; also the USD growth number): Shareholder Letter Q3 2025, PDF p.2.
Logistics efficiency callouts (Brazil unit shipping costs down 8% QoQ; Mexico fulfillment unit shipping cost record low, down >12% YoY): Shareholder Letter Q3 2025, PDF p.1–2.
Credit gauges (NIMAL 21.0%; 15–90 day NPL 6.8%): Earnings Presentation Q3 2025, Slide 13 (PDF p.13) and Slide 14 (PDF p.14).
Balance sheet “plumbing” labels (cash, restricted cash, funds payable to customers): Shareholder Letter Q3 2025, PDF p.9.
Net income → Adjusted EBITDA bridge: Shareholder Letter Q3 2025, PDF p.13.
CFO → Adjusted Free Cash Flow reconciliation (9M 2025): Shareholder Letter Q3 2025, PDF p.17.
(Optional supporting slide: Adjusted Free Cash Flow chart: Earnings Presentation Q3 2025, Slide 23 (PDF p.23).)
Disclaimer
This Deep Dive is an educational breakdown of a public company based on information available in the materials provided (e.g., annual/quarterly reports, investor presentations, earnings transcripts) and my interpretation of that information. It is designed to be a “bolt-on” intelligence layer to your own due diligence — not a replacement for it.
Independence: I do not accept compensation of any kind from the companies discussed. My research is driven solely by my personal search for high-quality compounders.
Skin in the Game: Unless otherwise stated, assume the author may hold a long position in securities mentioned. Any position creates bias — treat this as commentary, not gospel.
Not Financial Advice: Nothing here is investment advice, a recommendation, or a solicitation. I am not a financial advisor. You are responsible for your own decisions.
Error & Update Risk: Financial statements change, companies restate, guidance evolves, and I can be wrong. Verify key figures in the primary filings and consider reading the footnotes before deploying capital.