

The Atomic Moat FINS Analysis: Norbit ASA
Norbit’s quarter reads like a busy kitchen: orders flying in, margins a bit messy, and someone definitely over-ordered inventory.

The Setup
NORBIT is three businesses in one trench coat:
Oceans sells maritime tech (sonars, sub-bottom profilers, and security solutions) with short order-to-delivery timing and lumpy quarters.
Connectivity sells asset identification/monitoring/tracking tech,
PIR does R&D services plus contract manufacturing (now with a sharp tilt toward defence/security demand).
Q3 2025 reported NOK 505.4 million revenue and NOK 75.4 million operating profit (EBIT), with NOK 51.8 million net profit. Segment-wise: Oceans NOK 192.4 million, Connectivity NOK 107.5 million, PIR NOK 224.1 million—and yes, PIR is currently the growth engine.
This is a growth story that still has to pass the cash test.
[GROUP][REPORTED (IFRS)][Q3 2025] KEY STATS

REVENUE (NOKm)...........505.4
GROSS MARGIN (%)...........57
EBIT (NOKm)...........75.4
NET PROFIT (NOKm)...........51.8
DILUTED EPS (NOK)...........0.81
All figures above are reported for Q3 2025 in the interim report/presentation.
Personal Stake: No position (watchlist).
What the market thinks right now (Bulls vs Bears)
Market: Treats Norbit like a high-margin industrial that’s suddenly wearing a geopolitical tailwind.
Bull: Defence/security momentum in PIR plus strong Oceans sonar demand can keep margins elevated.
Bear: Inventory and “pending approvals” can turn a record year into a record headache.
Atomic Take: The operating result looks strong, but Q3 cash flow says “not so fast.”
What breaks this? If the inventory build doesn’t unwind into cash from operations over the next few quarters, the “record year” glow fades.
Balance Sheet (The Geiger Test)
The balance sheet is sturdy, but it’s getting heavier.
As of 30 Sep 2025, total assets were NOK 2,498.3 million and total equity NOK 1,253.5 million (equity ratio 50.2%). Net interest-bearing borrowings including leases were NOK 469.6 million, with cash at NOK 144.2 million.
The loudest flashing light is working capital: inventories were NOK 690.5 million at quarter-end, up from NOK 434.7 million at year-end 2024, which management links to sourcing ahead of higher activity (GNSS OBU deliveries and defence/security products).
Inventory is where good plans go to wait.
[GROUP][REPORTED (IFRS)][AS OF 30 SEP 2025] KEY STATS

TOTAL ASSETS (NOKm)...........2,498.3
TOTAL EQUITY (NOKm)...........1,253.5
EQUITY RATIO (%)...........50.2
INVENTORIES (NOKm)...........690.5
NIBD incl LEASES (NOKm)...........469.6
Balance sheet and leverage metrics as reported at 30 Sep 2025.
The Audit: The “strong balance sheet” line is true, but inventory-funded growth can impersonate strength until cash collection shows up.
The Audit: Net debt looks low on a ratio basis, yet absolute leverage can still creep if working capital keeps absorbing cash.
Atomic Take: Balance-sheet risk isn’t solvency—it’s whether growth is being prepaid in inventory.
What breaks this? A step-up in scrapping/obsolescence provisions tied to inventories would be the classic “we built the wrong pile” signal.
Cash Flow (Energy Output)
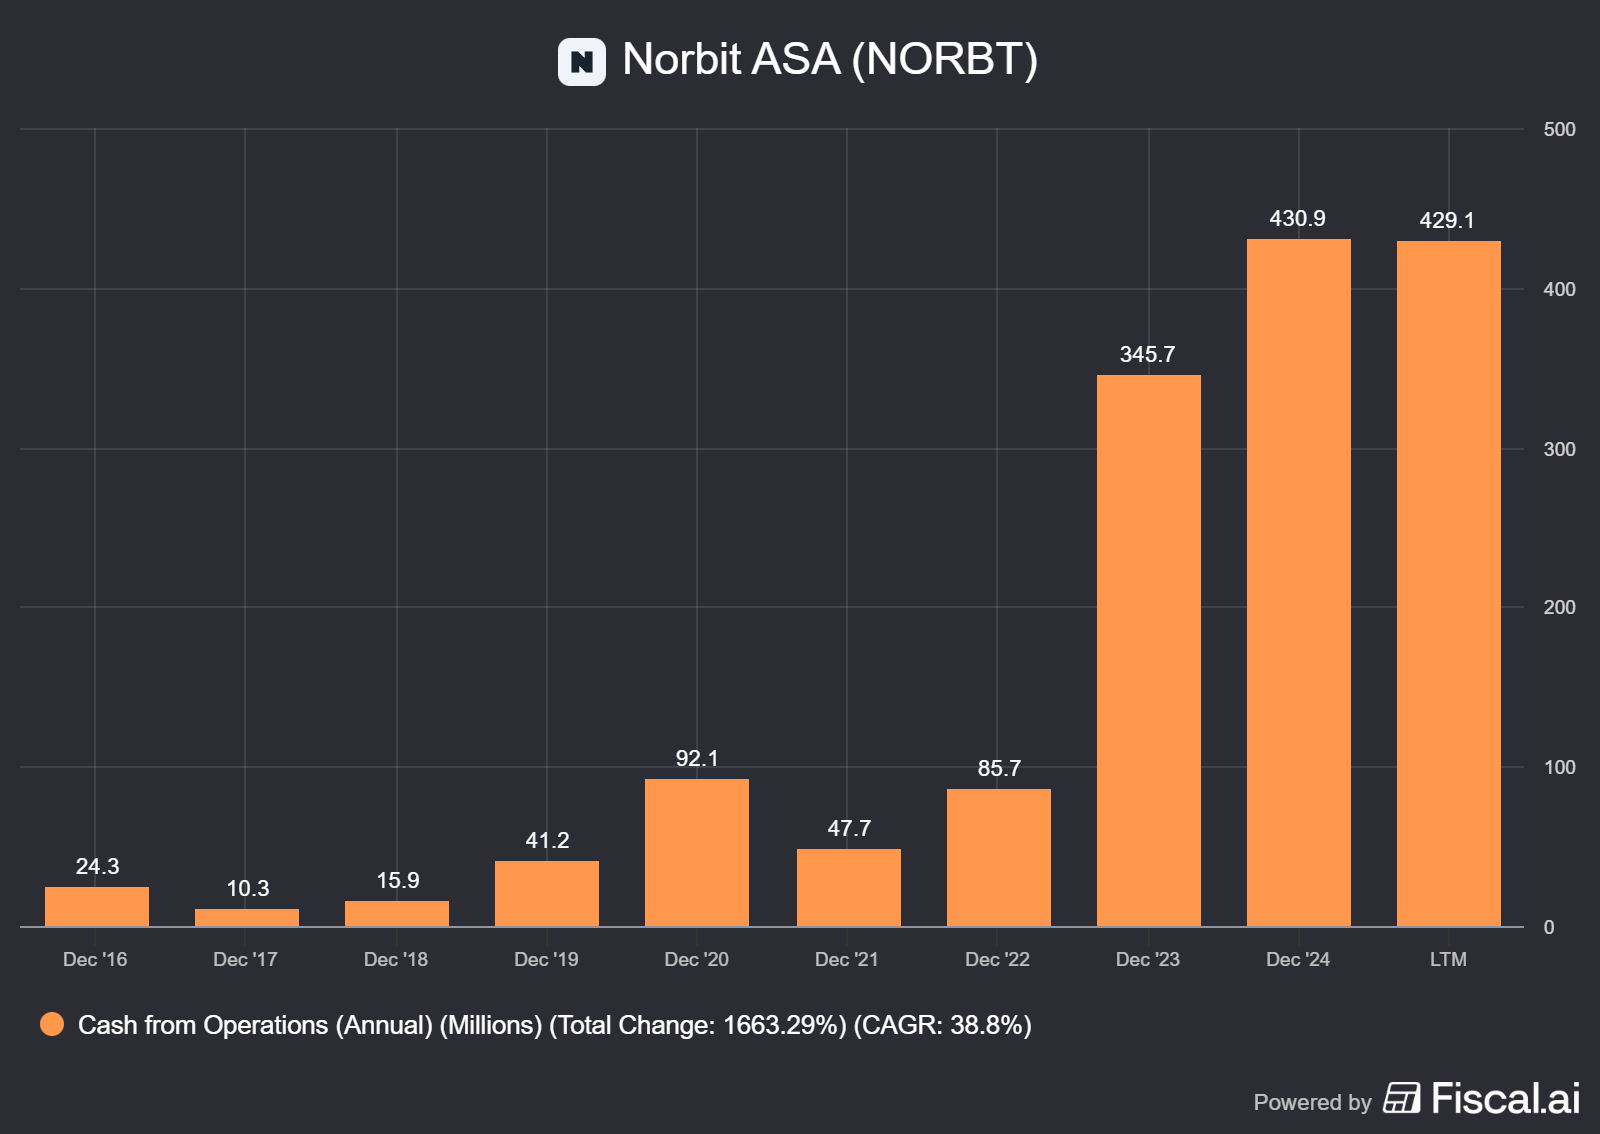
The quarter that looked great on profit leaked cash.
Q3 2025 cash from operating activities was negative NOK 1.9 million, driven by NOK 95.8 million working-capital build and NOK 14.4 million cash taxes paid. For 9M 2025, operating cash flow was NOK 285.4 million despite a net working-capital increase of NOK 93.3 million.
Investment spend stayed real: Q3 had NOK 11.0 million paid for PPE and NOK 29.8 million paid for intangibles (R&D capitalisation), matching the narrative that they’re investing to expand capacity and broaden the offering.
Cash doesn’t care about your slide deck.
[GROUP][REPORTED (IFRS)][Q3 2025] KEY STATS

CASH FROM OPS (NOKm)...........-1.9
CHANGE IN WORKING CAPITAL (NOKm)...........-95.8
TAXES PAID (NOKm)...........14.4
PPE+INTANGIBLE PAYMENTS (NOKm)...........40.8
CASH AFTER INVESTMENTS (NOKm)...........-42.7 (CFO - PPE - INTANG)
Cash flow lines are from the consolidated statement of cash flows and management commentary for Q3 2025.
The Audit: Q3 operating cash went negative while profit stayed positive—this is classic working-capital timing, but it needs to reverse, not become a habit. Inventory build is explicitly framed as prep for Q4 deliveries; that’s a falsifiable claim with a near-term deadline.
Atomic Take: Norbit can fund growth internally—when inventory stops eating the fuel.
What breaks this? If Q4 (or early 2026) doesn’t convert the inventory ramp into positive cash from operations, the “timing” explanation fails.
Share Capital & Insiders (Nucleus Check)
Share count is stable, but incentives and dividends are doing a lot.
At 30 Sep 2025, total shares were 63,948,695 and outstanding shares 63,805,548, with 143,147 treasury shares held. The company also reported 156,634 RSUs outstanding (vesting in Q2 2026 and Q2 2027), included in diluted EPS.
In Q3, the board resolved to award 35,075 shares under the share incentive program 2023, delivered as treasury shares. Also: an extraordinary dividend of NOK 3.00 per share was resolved (based on FY 2024), bringing total FY 2024 dividend to NOK 6.00 per share.
Capital allocation here is confident bordering on cocky.
[GROUP][REPORTED (IFRS)][AS OF 30 SEP 2025] KEY STATS

TOTAL SHARES ISSUED (COUNT)...........63,948,695
SHARES OUTSTANDING (COUNT)...........63,805,548
TREASURY SHARES (COUNT)...........143,147
RSUs OUTSTANDING (COUNT)...........156,634
TOP-20 OWNERSHIP (%)...........59.5
Share statistics and ownership concentration as disclosed for end-September 2025.
Atomic Take: Dilution risk looks contained, but the dividend posture raises the bar for cash conversion.
What breaks this? If buybacks/dividends continue while working capital remains a persistent cash drain, shareholder returns start competing with operating resilience.
Income Statement (Reaction Chamber)
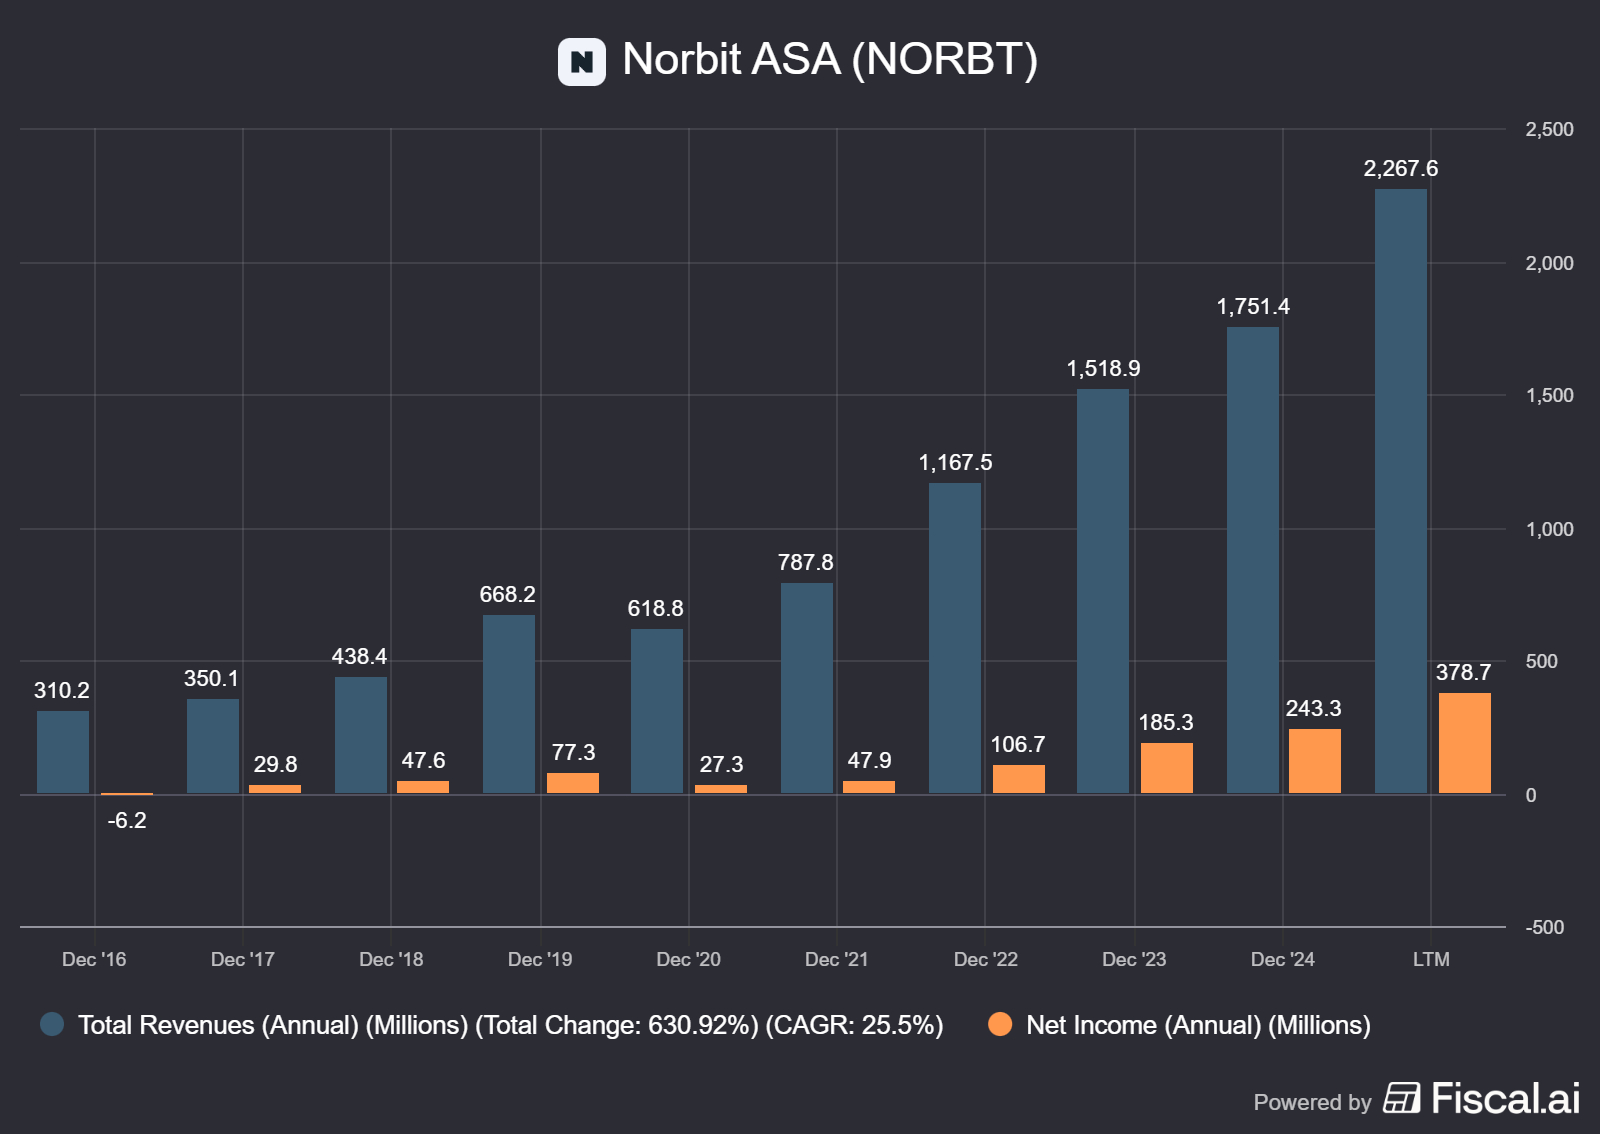
Growth is broad, margins are good, and the mix is changing.
Q3 revenue was NOK 505.4 million (up 36% YoY) and 9M revenue NOK 1,711.5 million (up 43% YoY). Q3 EBIT was NOK 75.4 million (15% margin), and 9M EBIT NOK 377.0 million (22% margin).
Group gross margin fell to 57% in Q3 from 63% a year ago, attributed to mix (higher PIR share) plus lower reported margins in Connectivity and Oceans from scrapping/obsolescence provisions and product mix effects.
This is a margin business that still has manufacturing realities.
[GROUP][REPORTED (IFRS)][9M 2025] KEY STATS

REVENUE (NOKm)...........1,711.5
GROSS MARGIN (%)...........58
EBITDA (NOKm)...........487.4
EBIT (NOKm)...........377.0
NET PROFIT (NOKm)...........272.8
Nine-month performance as reported in the interim report/presentation.
Quick Hits
• Oceans Q3: revenue NOK 192.4 million, EBIT NOK 41.3 million (21% margin).
• Connectivity Q3: revenue NOK 107.5 million, with NOK 15 million deliveries postponed into Q4.
• PIR Q3: revenue NOK 224.1 million, EBIT NOK 40.5 million (18% margin), driven by defence/security demand.
• Net financial items Q3: negative NOK 6.5 million, including net interest expense and FX gains.
• Management outlook: FY 2025 revenue NOK 2.5–2.6 billion and EBIT margin 24–25% (company forecast).
This is the scorecard. Each card separates what’s true today from what could happen next, then names the one signal that will prove it either way.
Signal 1: Export-license gated upside
🔒 FACT: Oceans has a NOK 75m security surveillance contract still awaiting Norwegian export license approval; no client payments have been made, and revenue recognition requires both payment and approval (excluded from guidance).
🧠 HYPOTHESIS: Approval arrives and the project becomes upside revenue, but timing stays opaque until paperwork moves.
📈 MONITOR: Export license decision and first customer payment (either is the gating trigger for recognition per the company’s condition).
Signal 2: Swedish “chemical tax” hangover
🔒 FACT: Swedish Customs reclassified Connectivity’s OBUs, levying chemical tax for 2021–2024 of SEK 26.3m plus SEK 7.2m interest/penalties; it was paid, while NORBIT seeks SEK 25.0m reimbursement and has appealed.
🧠 HYPOTHESIS: Refunds/deductions reduce the net cost materially, but adverse rulings keep the issue alive.
📈 MONITOR: Swedish Tax Authority reimbursement decisions and appeal outcomes, plus any new provisions disclosed.
Signal 3: Inventory vs reality
🔒 FACT: Management calls component supply shortage the most significant risk; lead times improved but remain elevated for some semiconductors, and reduced demand could create obsolete inventory.
🧠 HYPOTHESIS: The inventory build is controlled staging for Q4/Q1 deliveries, not a margin-eating write-down waiting room.
📈 MONITOR: Inventory level trend and gross margin commentary on scrapping/obsolescence in the next report(s).
Atomic Take: The P&L says “operating leverage,” but the mix shift plus working capital means execution has to stay clean.
What breaks this?: If FY guidance holds while gross margin keeps sliding due to scrapping/obsolescence, the quality of earnings deteriorates.
The Atomic Verdict
What you’re really underwriting is execution, not demand.
Quality: Diversified segments and strong profitability, with management explicitly targeting continued growth and innovation.
Health: Equity ratio 50.2% and covenant headroom disclosed; leverage is low on a NIBD/EBITDA basis.
Overhang: Inventory and “approval-gated” revenue (export license) can delay cash and create nasty surprises.
What must happen next: The Q3 working-capital build has to reverse as GNSS OBU and defence/security deliveries hit.
Status: Watchlist — STABLE ISOTOPE
Stars: ★★★★☆ — high reported margins; working-capital volatility.
Upgrade Triggers
• Cash from operations turns meaningfully positive while inventories fall from the NOK 690.5 million level.
• Connectivity delivers Q4 revenue within the NOK 200–240 million range (company guidance), confirming the postponed volumes and GNSS OBU ramp.
• FY 2025 lands within the company’s NOK 2.5–2.6 billion revenue and 24–25% EBIT margin forecast without further gross-margin erosion from scrapping/obsolescence.
Downgrade Triggers
• Inventories keep rising and cash from operations stays weak, contradicting the “preparing for Q4 deliveries” rationale.
• Any provision/charge spike tied to obsolete inventory beyond what’s described in estimates focus areas.
• Export license delay persists and the NOK 75 million security project remains non-revenue, keeping optionality as optionality.
Disclaimer
The content within Atomic Moat Research is designed to be a “bolt-on” intelligence layer to your own due diligence, not a replacement for it. I conduct these deep dives to decode financial statements and valuation models for the rational retail investor.
Independence: I do not accept compensation of any kind from the companies I review. My research is driven solely by my personal search for high-quality compounders.
Skin in the Game: Unless otherwise stated, assume the author holds long positions in the assets discussed. I invest my own real capital alongside my analysis. This creates a bias you should be aware of. While I strive for institutional-grade depth based on the most recent filings, my opinions are my own. I am not a financial advisor. All readers are encouraged to perform their own due diligence prior to deploying capital.