

The Atomic Moat FINS Analysis: Plejd AB. (PLEJD)
Plejd is the rare “smart home” company that doesn’t sell to consumers with influencer ads—it sells to electricians with products that just work.


The Setup: What Plejd actually does
Plejd is a Nordic supplier of smart lighting and smart products focused on the professional market, sold via electrical wholesalers to authorized electricians for fixed installations.
The company’s own preferred “truth” metric is installation value growth, because it strips out wholesaler/electrician inventory swings.
Q3 2025 was a strong quarter: net sales TSEK 215,349 and EBIT TSEK 45,075, with an EBIT margin of 20.9%.
This is a clean execution story wearing a slightly messy channel.
[PLEJD][REPORTED (IFRS)][Q3 2025] KEY STATS

NET SALES (TSEKm)...........215,349
GROSS MARGIN (%)...........52.6
EBITDA (TSEKm)...........68,005
EBIT (TSEKm)...........45,075
EPS (SEK)...........3.15 (BEFORE DILUTION)
Personal Stake: No position (watchlist).
What the market thinks right now (Bulls vs Bears)
Market: “Nordic smart lighting winner with real margins.”
Bull: Installations are growing strongly, suggesting demand is real, not channel stuffing.
Bear: Gross margin is slightly down versus last year and management flags launch/mix effects.
Atomic Take: Plejd is in a sweet spot—fast growth with real operating profitability—so the only job is to not trip over its own product and channel mix.
What breaks this: If installation value growth cools sharply while net sales stay high, it suggests channel inventory—not end demand—did the heavy lifting.
Balance Sheet (The Geiger Test)
This is a fortress for a growth company
As of 30 Sep 2025, Plejd reports total assets of TSEK 917,264 and equity of TSEK 665,842, with an equity/assets ratio of 72.6%.
Cash is TSEK 95,315, up from TSEK 43,825 at year-end 2024, which matters because it reduces the “small company surprise” risk.
Inventory is TSEK 215,642 and short-term receivables TSEK 205,699, so working capital is still a meaningful part of the asset base.
A strong balance sheet is insurance you don’t notice until you need it.
[PLEJD][REPORTED (IFRS)][AS OF 30 SEP 2025] KEY STATS

TOTAL ASSETS (TSEKm)...........917,264
TOTAL EQUITY (TSEKm)...........665,842
EQUITY/ASSETS RATIO (%)...........72.6
INVENTORY (TSEKm)...........215,642
CASH & CASH EQUIV (TSEKm)...........95,315
LEASE LIABILITY (TSEKm)...........26,497
The Audit:
Optical illusion #1 — “lots of cash” is true, but receivables + inventory are still big enough to swing if the channel blinks.
Optical illusion #2 — lease liabilities exist, but they’re not the kind of leverage that threatens a 72.6% equity ratio.
Atomic Take: The balance sheet looks built to keep shipping product through normal turbulence.
What breaks this: A sustained rise in inventory (TSEK 215,642 as of Sep 2025) without matching installation growth.
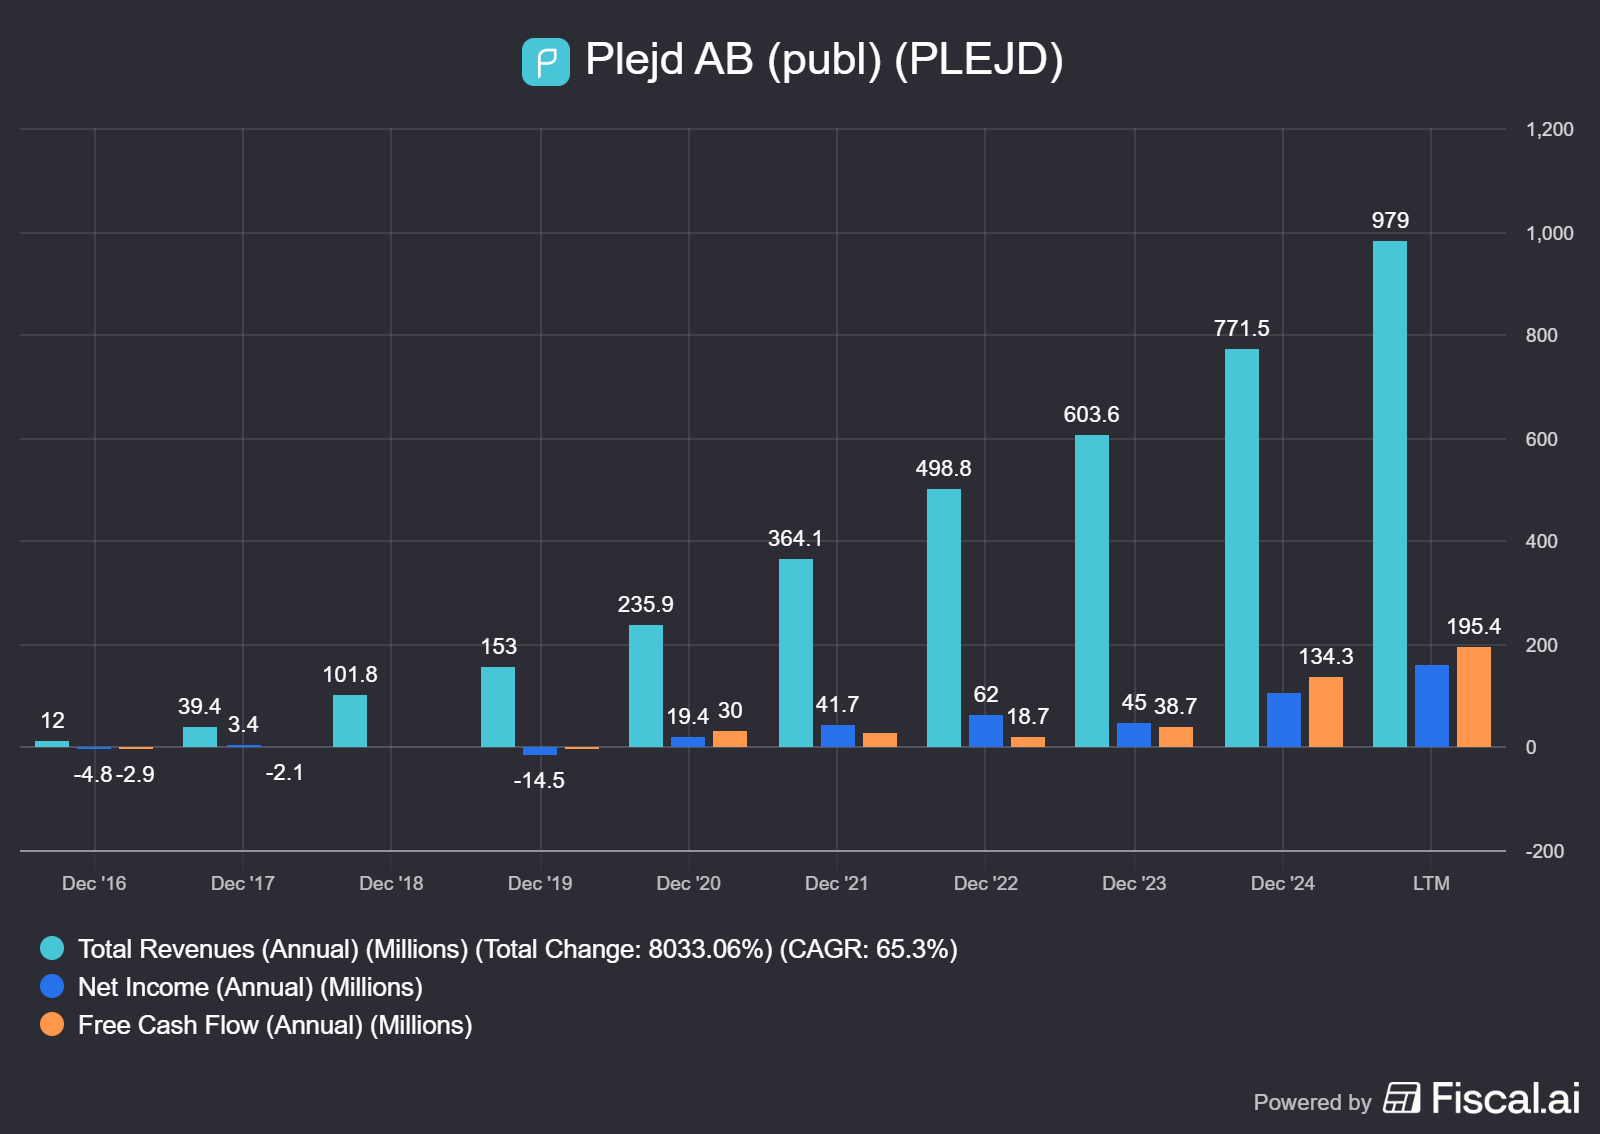
Cash Flow (Energy Output)
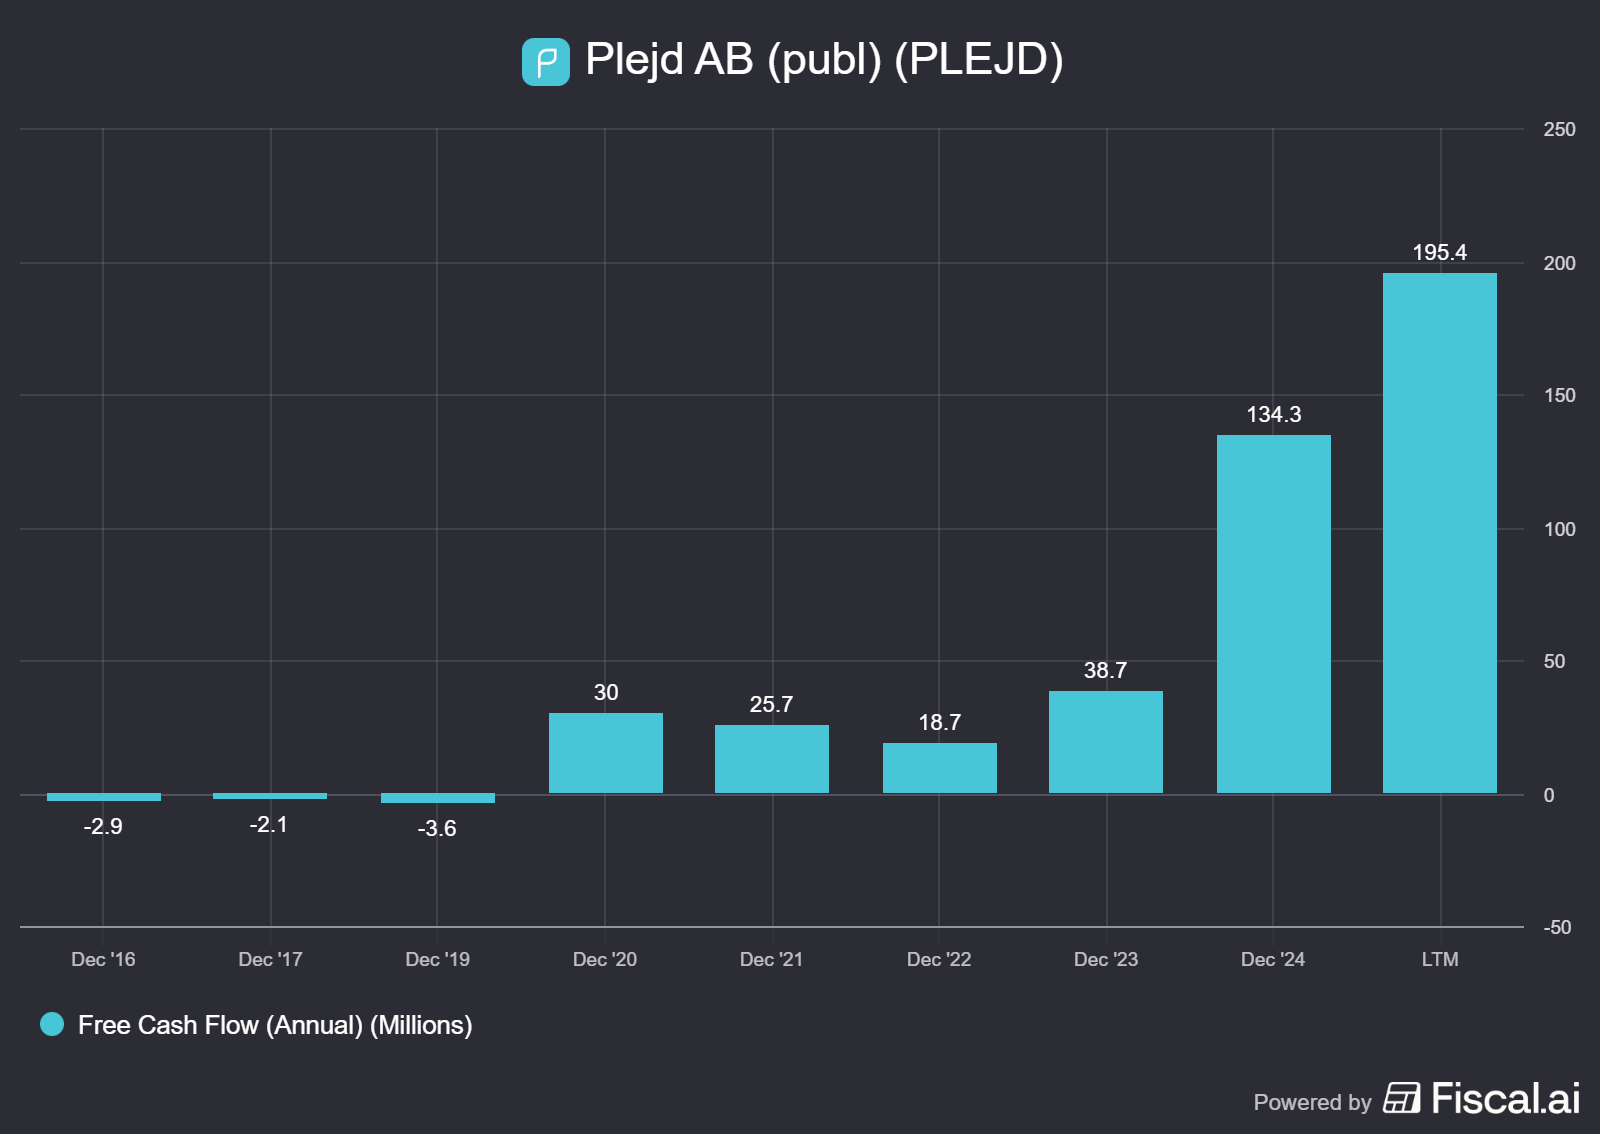
Profit is converting, but working capital still matters
Q3 2025 cash flow from operating activities was TSEK 53,612, supported by operating profit and non-cash addbacks.
But working capital moved against them in the quarter: inventories increased and receivables increased, partly offset by payables and other liabilities.
Investment cash outflow in Q3 was TSEK 29,075, mainly capitalized time tied to new products (intangible investments).
This is what healthy scaling looks like when it’s still physical.
[PLEJD][REPORTED (IFRS)][Q3 2025] KEY STATS

CASH FROM OPS (TSEKm)...........53,612
INTANGIBLE INVESTMENTS (TSEKm)...........22,949
TANGIBLE INVESTMENTS (TSEKm)...........6,126
CASH AFTER INVESTMENTS (TSEKm)...........24,537 (CFO - INTANG - TANGIBLE)
WORKING CAPITAL CHANGE (TSEKm)...........(9,691)
The Audit: The “installation growth” lens exists for a reason—sell-in can outrun sell-through, and cash will snitch.
Atomic Take: Plejd’s cash engine is working, but the channel can still create quarter-to-quarter noise.
What breaks this: Cash from ops falls materially while inventories rise (a bad combo in any distributor-heavy model).
Share Capital & Insiders (Nucleus Check)
Stable share count, small warrant dilution
Plejd reports 11,178,720 shares outstanding at the end of the period.
There are warrants that affect diluted EPS: in Q3 the diluted share count includes an adjustment of 88,982 shares for warrants.
They also disclose small “repurchase of share warrants” cash amounts in financing activities, but nothing here screams aggressive financial engineering.
This nucleus is calm.
[PLEJD][REPORTED (IFRS)][AS OF 30 SEP 2025] KEY STATS

SHARES OUTSTANDING (COUNT)...........11,178,720
DILUTION ADJ. FROM WARRANTS (COUNT)...........88,982 (Q3 EPS CALC)
EPS (SEK)...........3.15 / 3.13 (BEFORE/AFTER DILUTION)
REPURCHASE OF SHARE WARRANTS (TSEKm)...........0 (Q3)
Atomic Take: Dilution looks minor and visible, which is the only kind I like.
What breaks this? A step-up in dilution (warrants/other) without a matching step-up in earnings per share.
Income Statement (Reaction Chamber)
The machine is scaling, margins are holding
Q3 2025 net sales were TSEK 215,349, up 40.6% year-on-year, while gross margin was 52.6%, slightly below last year’s 53.5%.
EBITDA was TSEK 68,005 and EBIT TSEK 45,075, with EBIT margin 20.9%.
Management attributes the slightly lower gross margin to new products having lower initial gross margin and the impact of multiple launches, including luminaires.
Growth is strong, and it’s not eating the whole margin story.
[PLEJD][REPORTED (IFRS)][9M 2025] KEY STATS

NET SALES (TSEKm)...........646,435
GROSS MARGIN (%)...........52.1
EBITDA (TSEKm)...........213,714
EBIT (TSEKm)...........149,558
EPS (SEK)...........10.50 (BEFORE DILUTION)
Quick Hits
• Sweden Q3 revenue: TSEK 116,353; Norway: TSEK 77,586 (customer location).
• Installation value growth Q3: Global 44.4%, Sweden 29.3%, Norway 64.6%.
• Employees: 238 at period end (up from 211 a year ago).
This is the scorecard. Each card separates what’s true today from what could happen next, then names the one signal that will prove it either way.
Signal 1: Installation value vs channel noise
🔒 FACT: Plejd says installation value growth is the best measure of underlying organic growth because it excludes wholesaler/electrician inventory variation.
🧠 HYPOTHESIS: Sell-through stays strong enough that reported sales keep tracking installation growth, not short-term channel swings.
📈 MONITOR: Global installation value growth stays near Q3’s 44.4% level while inventories don’t outpace sales.
Signal 2: Gross margin dip (trough or trend)
🔒 FACT: Management expects gross margin effects from cost-optimized downlights and inventory management changes to become visible further ahead, with production initiatives aimed at improving gross profit showing noticeable effects during the coming year.
🧠 HYPOTHESIS: The slight gross margin dip is a launch/mix trough, not structural erosion.
📈 MONITOR: Gross margin holds around Q3’s 52.6% level while EBIT margin remains above 20%.
Atomic Take: Plejd is scaling like a disciplined industrial-tech company, but gross margin is the canary.
What breaks this: Gross margin slides for multiple quarters without a clear “new products ramping” explanation.
The Atomic Verdict: A high-quality compounding machine, with channel physics
• Quality: Strong organic indicators (installation growth) plus consistent profitability.
• Health: High equity ratio (72.6%) and rising cash (TSEK 95,315).
• Overhang: Channel inventory can distort reported sales and working capital.
• What must happen next: Keep installation growth strong while gross margin stabilizes as product mix matures.
Status: High Conviction — STABLE ISOTOPE
Stars: ★★★★☆ — strong growth; margin discipline.
Upgrade Triggers
• Installation value growth stays strong (using Q3 global 44.4% as the baseline).
• Cash from operations remains robust (Q3 CFO TSEK 53,612) while inventories normalize.
• Gross margin holds at or above 52% while EBIT margin stays above 20%.
Downgrade Triggers
• Inventory rises materially above TSEK 215,642 without matching installation growth.
• EBIT margin falls below 20% for multiple quarters.
• Cash from operations weakens materially versus 9M CFO TSEK 159,646 trend.
Plejd dominates the home, but what about the hospital? We recently covered Devyser Diagnostics (DVYSR), another Swedish firm applying a simple ‘IKEA-style’ model to a complex industry.
Disclaimer
The content within Atomic Moat Research is designed to be a “bolt-on” intelligence layer to your own due diligence, not a replacement for it. I conduct these deep dives to decode financial statements and valuation models for the rational retail investor.
Independence: I do not accept compensation of any kind from the companies I review. My research is driven solely by my personal search for high-quality compounders.
Skin in the Game: Unless otherwise stated, assume the author holds long positions in the assets discussed. I invest my own real capital alongside my analysis. This creates a bias you should be aware of. While I strive for institutional-grade depth based on the most recent filings, my opinions are my own. I am not a financial advisor. All readers are encouraged to perform their own due diligence prior to deploying capital.
I enjoyed the format in which you reported, especially the way you structured the parts and commented on them individually, which didn't create distortion in your views and expressed it clearly. I like the company. The growth trend needs to be monitored, especially inventory levels and recieveables. I still think the valuation is high, at 50 times earnings. I am willing to pay 30 times TTM earnings, no matter how wonderfully they execute, in pricing you gotta maintain discipline, cause that's all that matters.