

The Atomic Moat FINS Analysis: Evolution AB (EVO)
Evolution is a cash-printing machine that’s currently arguing with a stubborn corner of the world about who’s allowed to play, and on what terms.


New to The Atomic Moat? This analysis of Evolution AB ($EVO) is a prime example of how we dissect high-quality compounders. If you want deep dives and FINS sent to your inbox, join 700+ other investors below.
The Setup
This is the house supplying the casino.
Evolution develops and licenses B2B online casino solutions to gaming operators, with revenue largely driven by commissions from customer activity.
Q3 2025 net revenues were EUR 507.1m (IFRS) and adjusted EBITDA was EUR 336.9m.
The adjusted EBITDA margin was 66.4% (management’s adjusted metric).
The business still throws off cash even when growth gets moody.
[GROUP][REPORTED (IFRS)][Q3 2025] KEY STATS

NET REVENUES (EURm)...........507.1
ADJ EBITDA (EURm)...........336.9
ADJ EBITDA MARGIN (%)...........66.4
PROFIT FOR PERIOD (EURm)...........252.3
EPS AFTER DILUTION (EUR)...........1.25
Personal Stake: No position (watchlist). UPDATE: As of January 9th, I do own shares in Evolution AB.
What the market thinks right now (Bulls vs Bears)
Market: “Great margins, but Asia is the plot twist.”
Bull: Mix is improving, regulated share is rising, and cost control keeps margins in range.
Bear: Cybercrime + regulation noise can keep Asia weak and cap growth.
Atomic Take: EUR 336.9m of EBITDA in a “down” quarter is the kind of problem you want.
What breaks this? If adjusted EBITDA margin drops below the company’s 66–68% range for more than a quarter, the moat narrative needs re-testing.
Balance Sheet (The Geiger Test)
The balance sheet is strong, but it’s not a hardware company—it’s an intangible one.
As of 30 Sep 2025, total assets were EUR 5,173.6m (IFRS) and total equity was EUR 3,819.6m.
The equity/assets ratio was 73.8%, which is comforting—until you remember goodwill is EUR 2,336.2m.
Cash and cash equivalents ended at EUR 656.4m, and the bond portfolio was EUR 103.2m.
Also sitting there: a current tax receivable of EUR 658.1m, which is real but not exactly “spend it on a yacht” money.
The Geiger counter stays quiet, but the glow is mostly goodwill.
[GROUP][REPORTED (IFRS)][AS OF 30 SEP 2025] KEY STATS

TOTAL ASSETS (EURm)...........5,173.6
TOTAL EQUITY (EURm)...........3,819.6
EQUITY/ASSETS RATIO (%)...........73.8
CASH AND CASH EQUIV (EURm)...........656.4
CURRENT TAX RECEIVABLE (EURm)...........658.1
The Audit: A high equity ratio looks bulletproof, but EUR 2,336.2m of goodwill means the “hard” backing is thinner than it seems.
That EUR 658.1m tax receivable can make liquidity feel richer than it is, because timing is doing some heavy lifting.
Atomic Take: This is financially resilient, but the balance sheet is telling you it’s a platform—not a pile of factories.
What breaks this? Any material impairment on goodwill would be the cleanest “your past growth assumptions were wrong” alarm.
Cash Flow (Energy Output)
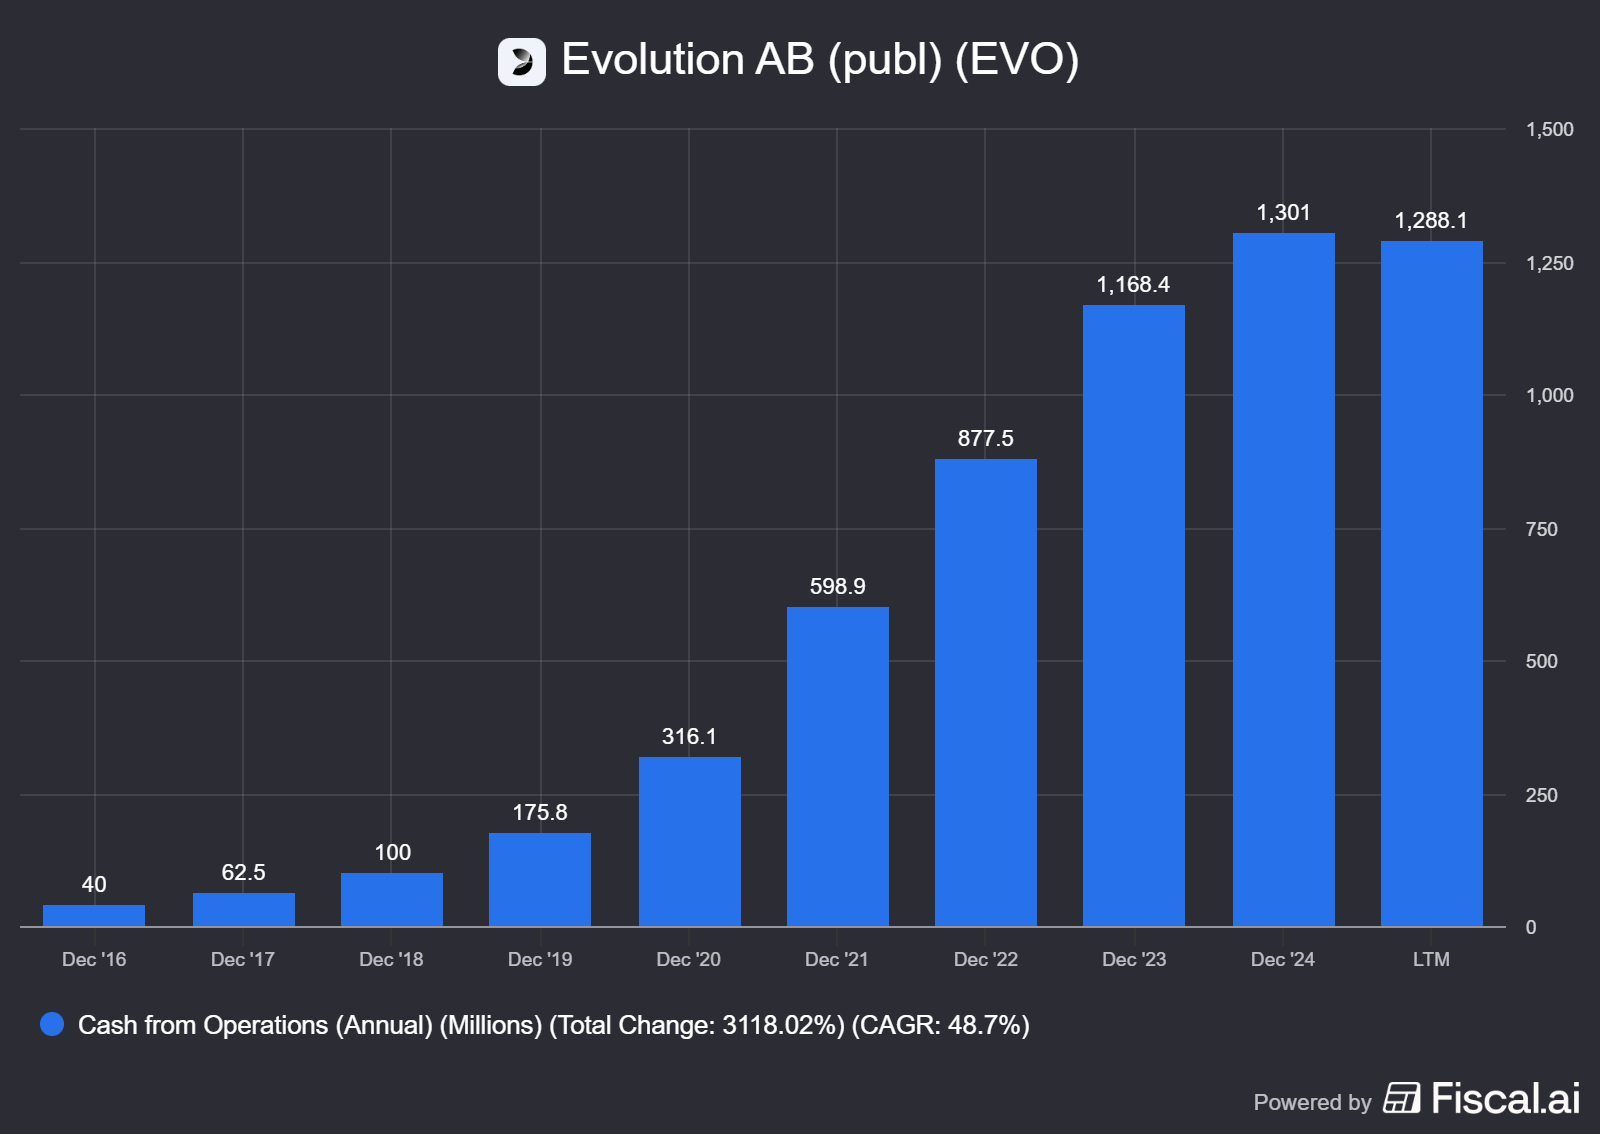
Cash flow is still the best lie detector, and Evolution is still passing.
Cash flow from operating activities in Q3 2025 was EUR 371.9m (IFRS).
Cash taxes paid were EUR 2.0m, and the company shows positive movements in working capital lines in the quarter.
Q3 investments were EUR 15.9m in intangibles and EUR 13.9m in PPE.
That sets up a simple, falsifiable cash proxy: operating cash minus those two “capex-like” lines.
The reactor is still hot.
[GROUP][REPORTED (IFRS)][Q3 2025] KEY STATS

CASH FROM OPS (EURm)...........371.9
INTANGIBLE INVESTMENTS (EURm)...........15.9
PPE INVESTMENTS (EURm)...........13.9
CASH AFTER INVESTMENTS (EURm)...........342.1 (CFO - INTANG - PPE)
REPURCHASE OF OWN SHARES (EURm)...........187.0
The Audit: Shareholder returns are aggressive, but they’re being paid out of genuine operating cash generation.
The quarter’s cash conversion story in the deck is flattering; the filing is your anchor.
Atomic Take: Evolution’s moat is basically “cash first, questions later,” and Q3 still supports that.
What breaks this? If operating cash flow falls while repurchases stay elevated, capital allocation stops being “disciplined” and starts being “narrative.”
Share Capital & Insiders (Nucleus Check)
Capital returns are a feature, not a footnote.
Evolution repurchased 2,501,979 shares in Q3 2025, and held 3,617,371 own shares as of 30 Sep 2025. During the first nine months, repurchases totalled EUR 406.5m.
Dividends paid in the first nine months were EUR 572.5m.
Management’s stated capital allocation includes a dividend policy of minimum 50% of net profit and distributing 100% of excess cash.
This company behaves like it wants to be your favourite ATM.
[GROUP][REPORTED (IFRS)][AS OF 30 SEP 2025] KEY STATS

OUTSTANDING SHARES (COUNT)...........200,844,791
OWN SHARES HELD (COUNT)...........3,617,371
SHARES REPURCHASED (COUNT)...........2,501,979 (Q3 2025)
BUYBACK SPEND (EURm)...........406.5 (9M 2025)
DIVIDENDS PAID (EURm)...........572.5 (9M 2025)
Atomic Take: The nucleus is stable, but the payout machine raises the standard for operational stability in Asia.
What breaks this? Any pause or visible downshift in the stated EUR 500m repurchase intention would signal management sees higher risk ahead.
Income Statement (Reaction Chamber)
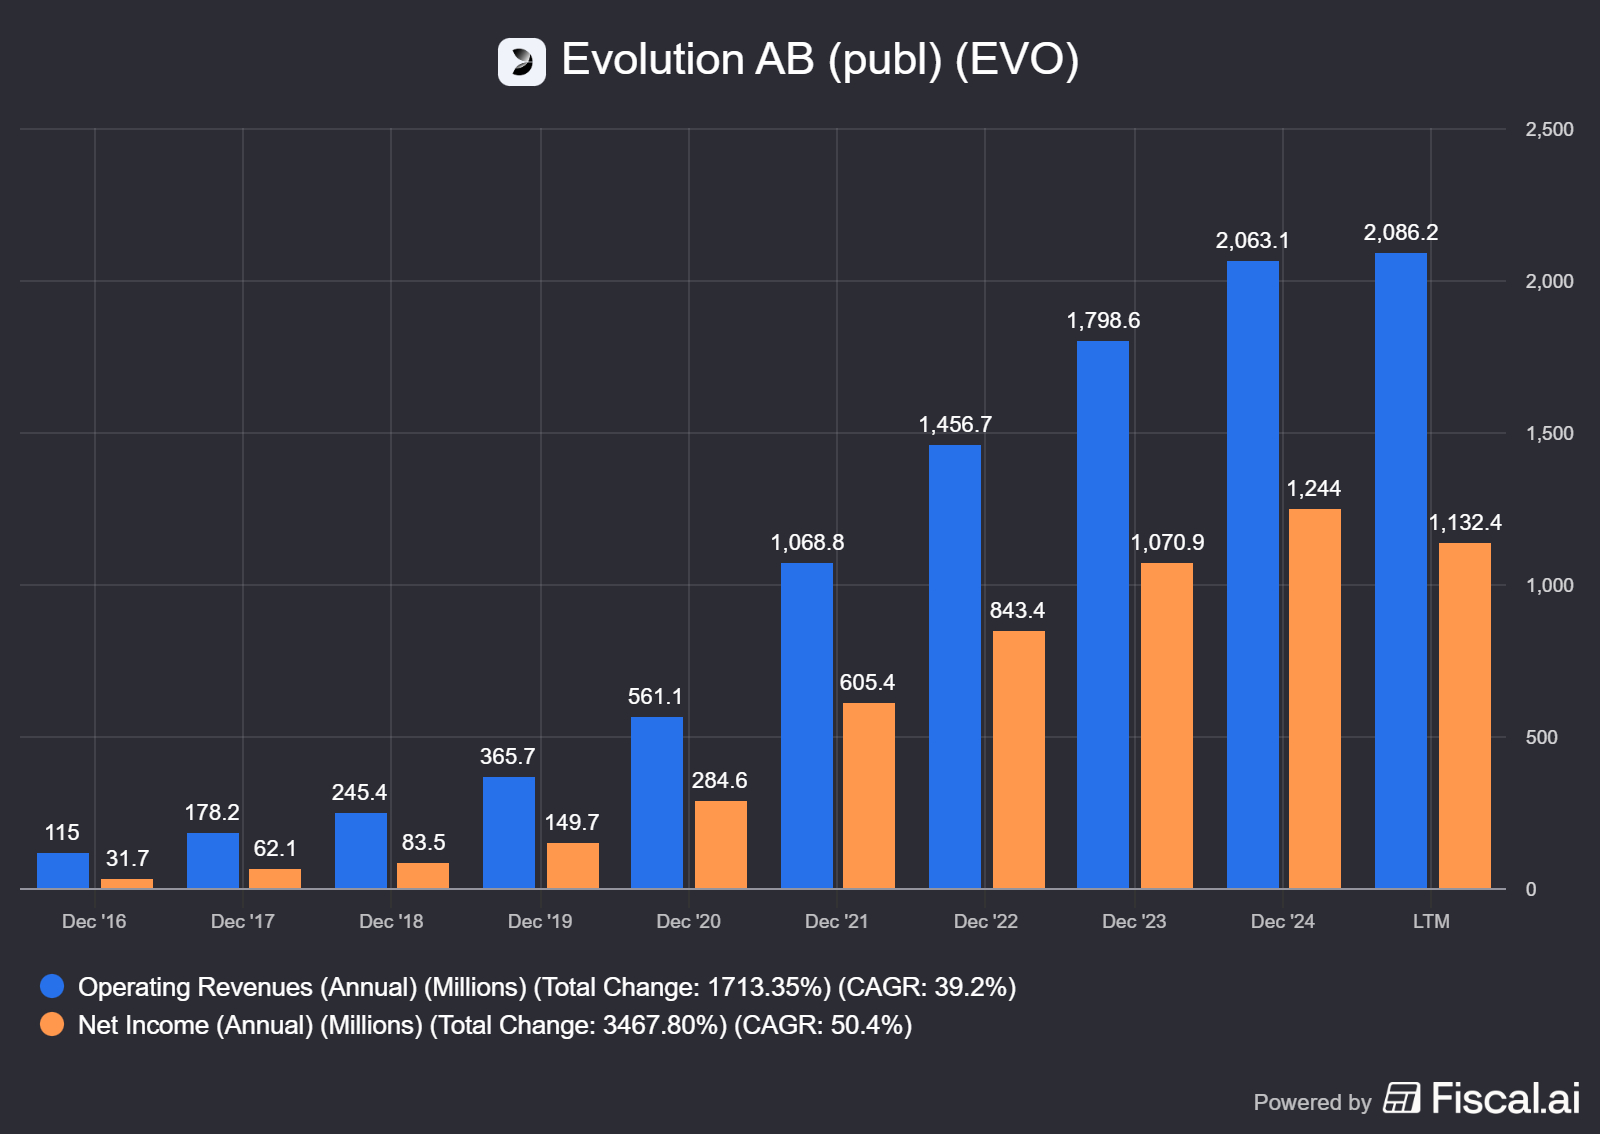
The margins are still absurd, but the growth engine is misfiring in one region.
Q3 2025 net revenues were EUR 507.1m (IFRS), down 2.4% year-on-year. At constant currency, management estimates growth of 3.9%.
Live revenue was EUR 431.7m, and RNG revenue was EUR 75.5m.
The company notes RNG outperformed Live on growth in the quarter, helped by slots studios and the launch of Sneaky Slots.Regionally in Q3, Europe contributed EUR 182.2m and Asia contributed EUR 189.1m.
North America was EUR 74.2m, and Latin America was EUR 39.8m.
Regulated markets were 46% of revenue, with regulated revenue EUR 234.3m.Operating profit (EBIT) was EUR 296.6m, and profit for the period was EUR 252.3m.
The effective tax rate in Q3 was 15.2%.
Quick Hits
• Q3 2025 operating expenses were EUR 210.5m (IFRS), up 5.3% YoY in the presentation commentary.
• Q3 2025 other operating revenues were zero, while 2024 included an earn-out liability reduction of EUR 59.7m.
• Management expects to stay within 66–68% adjusted EBITDA margin in Q4.
This is the scorecard. Each card separates what’s true today from what could happen next, then names the one signal that will prove it either way.
Signal 1: Asia cyber drag
🔒 FACT: Management says Asia is being dragged by ongoing cybercriminality and that Q3 countermeasures were over-extended, hurting revenue.
🧠 HYPOTHESIS: Better-balanced countermeasures restore growth without harming legitimate users.
📈 MONITOR: Asia revenue trend versus Q3’s EUR 189.1m baseline.
Signal 2: Regulation volatility
🔒 FACT: The company highlights regulatory volatility, including the Philippines being “very volatile” early in regulation.
🧠 HYPOTHESIS: A higher regulated mix supports steadier growth, even if margins normalize over time.
📈 MONITOR: Regulated revenue share versus the current 46% level.
Signal 3: Sweepstakes exposure
🔒 FACT: The CEO describes a “prudent approach” to sweepstakes exposure, adapting when legal interpretations change.
🧠 HYPOTHESIS: This conservatism limits downside in North America while dedicated studio growth continues.
📈 MONITOR: North America revenue versus Q3’s EUR 74.2m baseline.
Atomic Take: The P&L is still gorgeous, but the Asia issue is no longer “temporary” until proven otherwise.
What breaks this? If Asia remains structurally down while Europe stays flat, the group won’t outrun the market “by default.”
The Atomic Verdict
This is a premium machine with one noisy gear.
• Quality: A 66.4% adjusted EBITDA margin is still elite for a scaled platform business.
• Health: EUR 656.4m cash plus EUR 103.2m bonds supports aggressive capital returns.
• Overhang: Asia volatility and regulatory interpretation risk remain the headline overhangs.
• What must happen next: Asia needs to stabilize while regulated share keeps rising from 46%.
Status: Overhang-Heavy — STABLE ISOTOPE
Stars: ★★★★☆ — exceptional margins; Asia/regulation noise.
Upgrade Triggers
• Asia revenue returns to quarter-on-quarter growth from the EUR 189.1m level.
• Regulated share moves above 46% while margins stay in the 66–68% range.
• Operating cash remains strong while buybacks approach the stated EUR 500m intention for 2025.
Downgrade Triggers
• Adjusted EBITDA margin falls below 66% and stays there for more than a quarter.
• North America or Europe turns negative year-on-year while Asia is still weak.
• Repurchases slow meaningfully despite continued operating cash strength, implying higher perceived risk.
Did you enjoy this? Then you might also like: Would Peter Lynch buy Evolution today?
Disclaimer
The content within Atomic Moat Research is designed to be a “bolt-on” intelligence layer to your own due diligence, not a replacement for it. I conduct these deep dives to decode financial statements and valuation models for the rational retail investor.
Independence: I do not accept compensation of any kind from the companies I review. My research is driven solely by my personal search for high-quality compounders.
Skin in the Game: Unless otherwise stated, assume the author holds long positions in the assets discussed. I invest my own real capital alongside my analysis. This creates a bias you should be aware of. While I strive for institutional-grade depth based on the most recent filings, my opinions are my own. I am not a financial advisor. All readers are encouraged to perform their own due diligence prior to deploying capital.