

Deep Dive: Medpace
A founder-led, cash-rich compounding machine aggressively eating its own share count.

First off, let me tell you how this week’s Deep Dive actually came to be.
I just finished reading Christopher Mayer’s fantastic book, 100 Baggers, for the fourth time. Yup, the fourth. When you find a legitimate blueprint for building generational wealth, you study the architecture until you memorize the floor plan.
After putting the book down this last time, I decided to put theory into practice. I sat down and built a custom stock screener specifically designed to hunt for the traits Mayer talks about: insanely high returns on capital, long runways for reinvestment, and management teams with real skin in the game. I wanted to find the compounding machines of tomorrow before everyone else caught on.
But here is where the story gets really interesting.
As the ticker symbols started spitting out of my screener, I noticed a massive, undeniable coincidence. A huge chunk of the companies lighting up my list were exactly the same businesses sitting right inside legendary British investor Terry Smith’s current portfolio.
If you’ve been reading Atomic Moat for a while, you know I hugely admire Terry Smith. His entire investing philosophy is beautifully, brutally simple: buy good companies, don’t overpay, then do nothing.
And this philosophy aligns perfectly with holding on to potential 100-baggers.
When my 100 Baggers screener started rhyming perfectly with the Fundsmith playbook, I knew immediately that I was digging in the right spot.
And sitting right there, gleaming near the top of that meticulously filtered list, was a clinical research organization called Medpace.
On the initial screen, the numbers looked almost too good to be true. The return on capital was nuclear, the cash generation was pristine, the buybacks were massive, and the founder was still steering the ship. It looked incredibly interesting, despite being a tad on the larger side, market-cap-wise.
So, I did what we always do here: I rolled up my sleeves, ignored the Wall Street noise, and ripped into the actual SEC filings to see if the engine matches the paint job.
Here is what I found.
If You’re In a Rush
What they do: They are the outsourced operational engine for clinical trials. When a biotech company invents a new drug, Medpace steps in to recruit the human subjects, run the specialized lab tests, manage the massive datasets, and navigate the regulatory red tape.
Why it’s ‘hated’: CROs sit straight downstream of biotech funding cycles. If biotech catches a cold, CROs get pneumonia. On top of that, Medpace carries a persistent “founder control + related-party optics” fog that can keep institutional money managers incredibly twitchy, even when the actual P&L results are squeaky clean.
What fixes it: To shake off the bears, their awards need to stay visibly ahead of their revenue (meaning a book-to-bill > 1). The backlog needs to actually grow (not just convert into cash), and FY2026 needs to land safely inside their guidance without relying on any “working-capital magic” to make the math work.
What is Medpace?

If you are new to Medpace, your first thought may be if they are biotech company. And people are easy to dismiss biotech companies due to their riskier, binary nature.
Medpace invents exactly zero drugs.
They own zero drug patents.
If one of the trials they run cures a major disease, Medpace does not get a single dime of the royalty checks.
They are a pure service business.
Think of them like a general contractor building a custom home. The biotech company is the wealthy architect who drew the blueprints and owns the land. Medpace is the construction crew. They show up with the hard hats, pour the concrete, run the plumbing, and make sure the house passes the strict city inspections (the FDA).
Here is why investors love this specific setup: the biotech company takes 100% of the scientific risk. If a drug completely fails in Phase III testing and turns out to be useless, the biotech company’s stock might collapse to zero.
Medpace generally gets paid for work performed, but it does not get paid for future work if projects are cancelled or delayed.
I like to think of them like they sell the picks and shovels to the gold miners. Whether the miner strikes gold or finds dirt, Medpace gets paid for the shovel. And this is a business model I like.
Imagine you’re a biotech CEO with a molecule that looks brilliant on paper. Now imagine the nightmare of turning that molecule into an FDA-approved drug. You have to coordinate investigators, patients, specialized labs, data, and regulators across the globe, without blowing your budget or ruining the dataset.
That exact mess is the problem Medpace sells relief from.
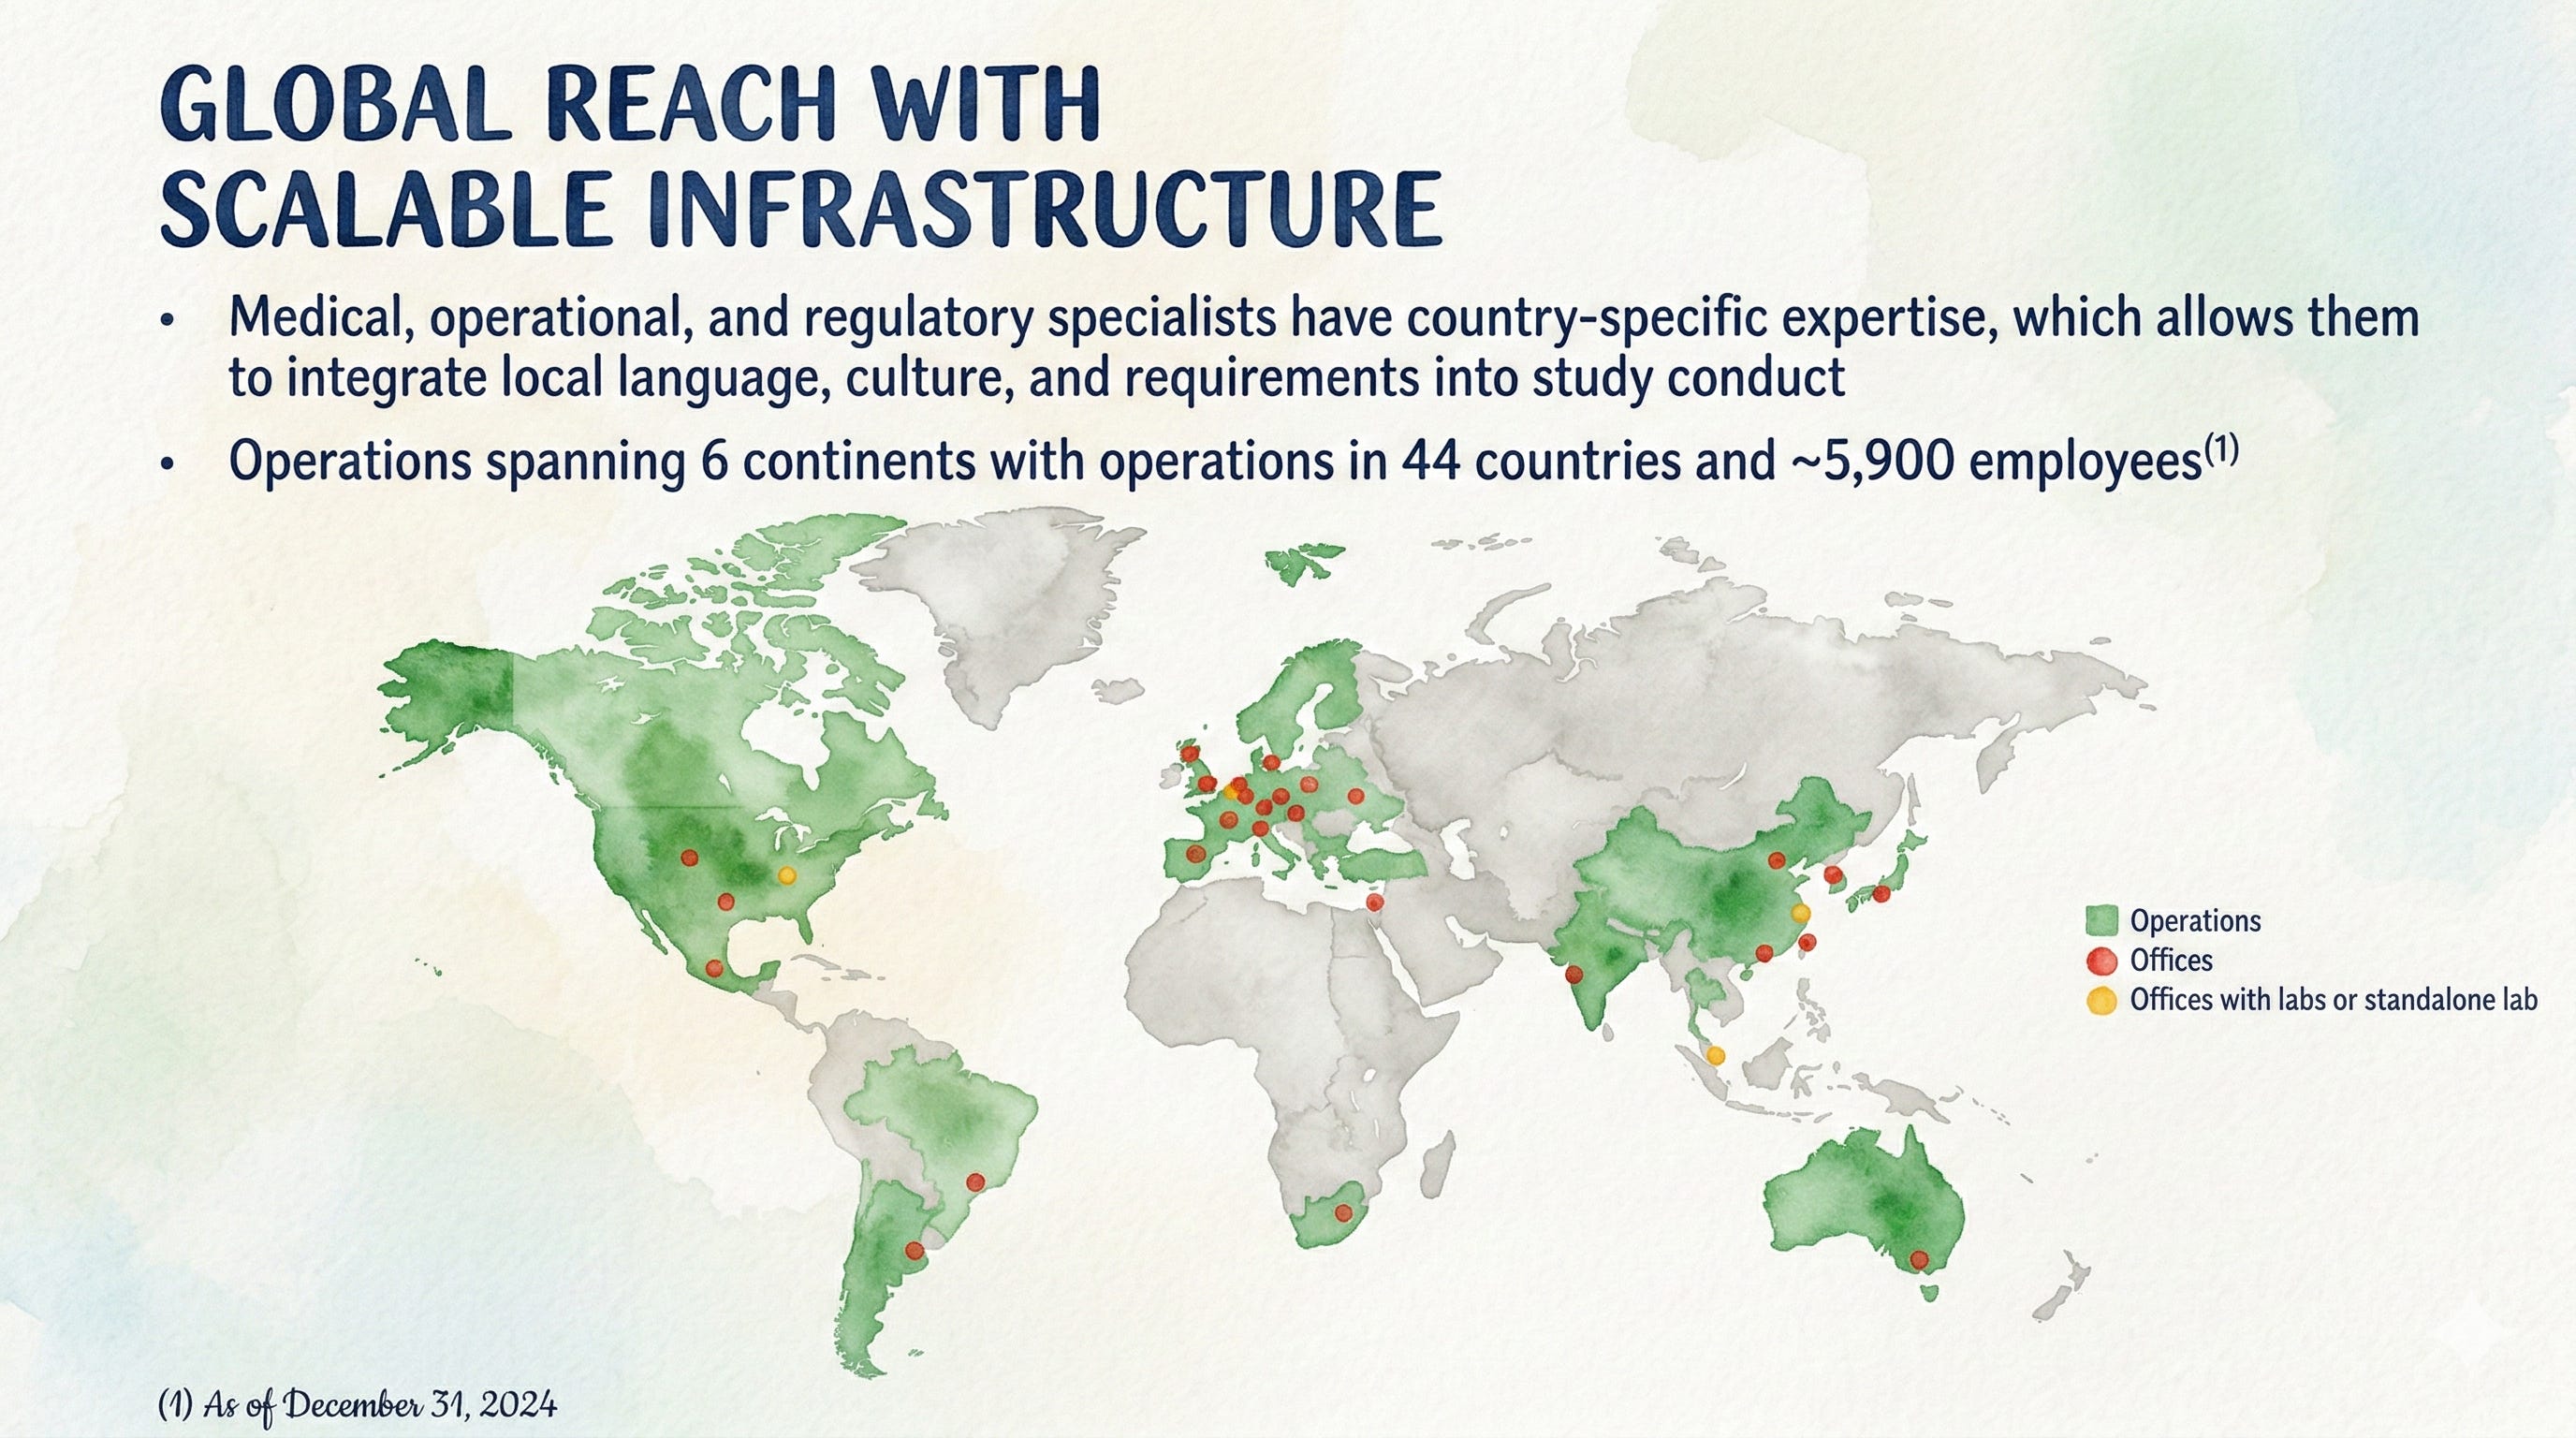
In their own words, Medpace is a global provider of clinical research-based drug and medical device development services.
They handle full-service Phase I–IV clinical development, plus central lab coordination, project management, regulatory affairs, clinical monitoring, data management/analysis, pharmacovigilance, and post-marketing support. They also run the heavy science: bio-analytical lab services, clinical pharmacology, imaging, and ECG reading support.
The “product” here is not a software license. It’s execution under constraints.
How do they get paid?
They earn fees through customer contracts that are typically fixed-fee or unit-of-service. Most contracts are structured beautifully: they collect an upfront fee at signing, with the balance collected over the contract duration (via a billing schedule or milestones). Revenue is recognized over time as services are performed (they note progression is measured primarily using an input method, cost-to-cost).
August J. Troendle is the Chief Executive Officer and founder. He controls approximately 19.0% of the outstanding shares through direct and beneficial ownership (including shares held by Medpace Investors LLC).
In other words: this is a true owner-operator structure, not a “CEO-for-hire” passing through.
So where’s the moat and the switching cost?
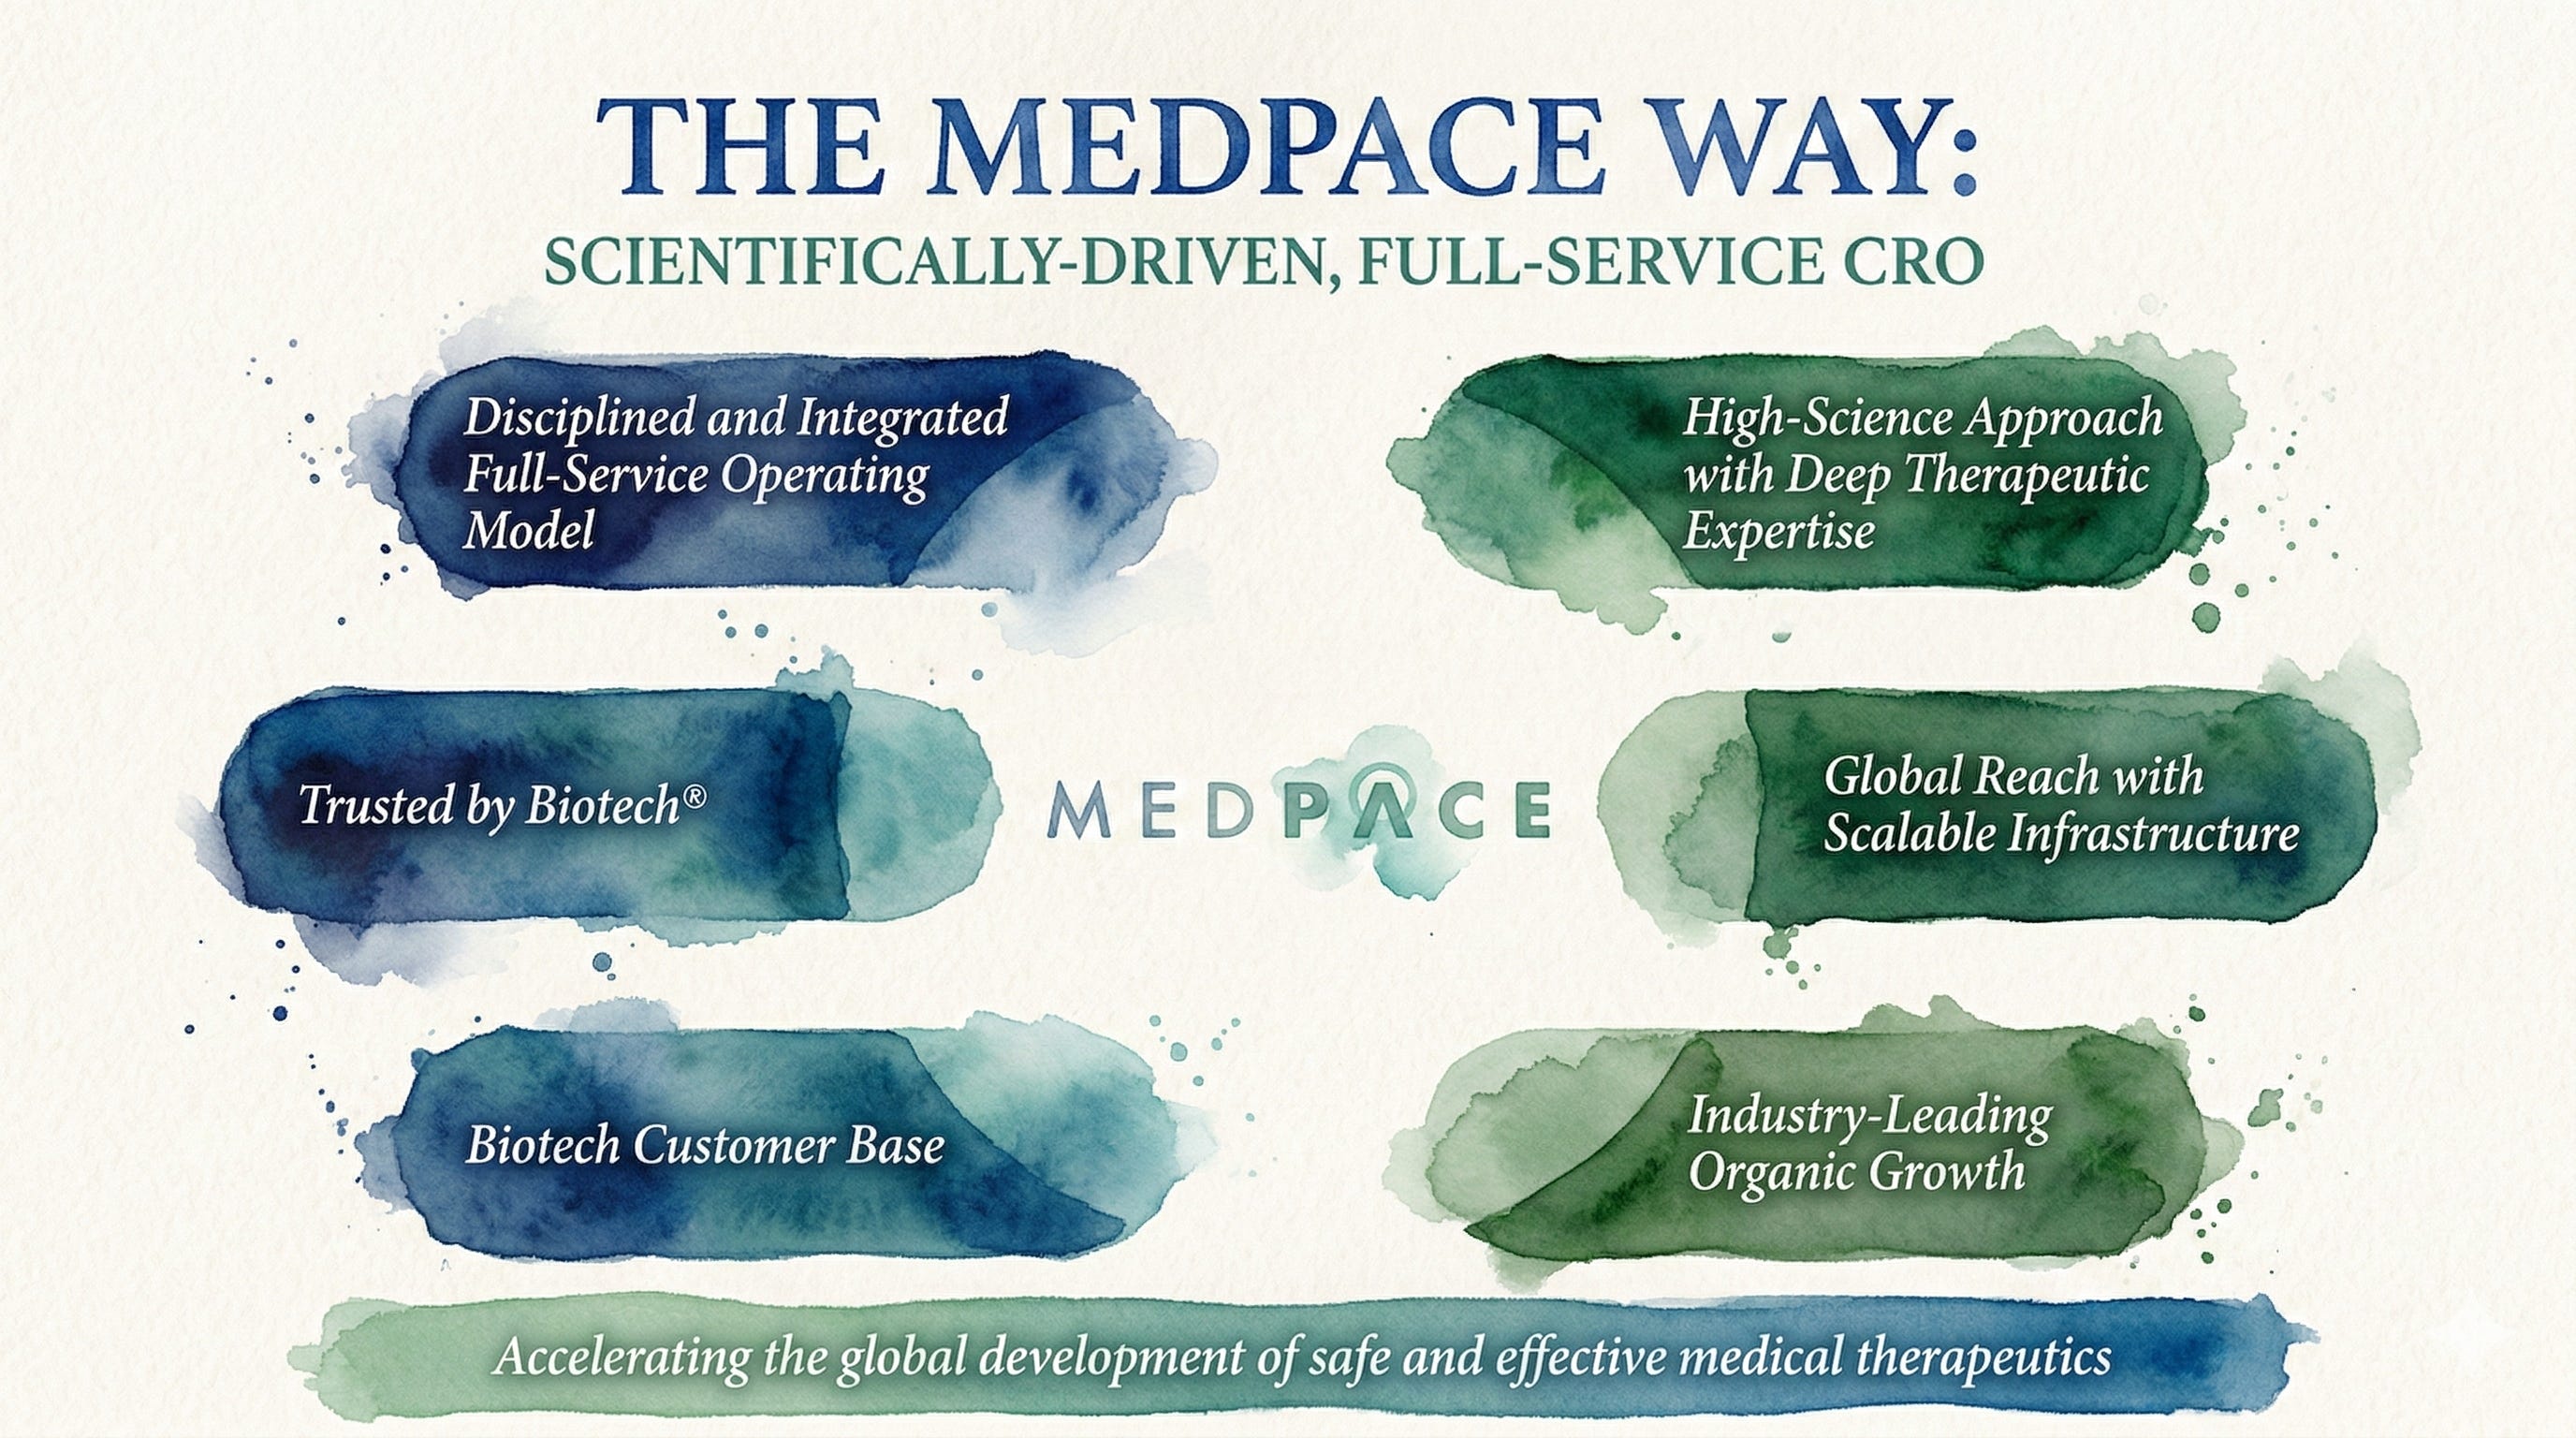
Medpace pitches a disciplined, integrated full-service operating model, complete with coordinated labs, Phase I clinic capabilities, and internal technology.
Their contracts can range from a few months to several years. But customers can terminate, typically with ~30 days’ notice terms, and cancellations happen in the ordinary course of business.
The switching costs here are less about “contractual lock-in” and much more about “operational pain.” Once a trial is underway, swapping out the team managing your sensitive data, monitoring, labs, and regulatory rhythm is like changing pilots mid-flight: it’s technically possible, but it’s expensive, risky, and slow.
Atomic Take: Medpace sells “complexity insurance” (not software) and the moat is integrated execution plus practical switching friction, even if the contracts aren’t ironclad.
Falsifier: Evidence of weakening practical stickiness (a sustained drop in awards/book-to-bill alongside rising cancellations or backlog pressure disclosed over time).
The Setup
Here’s the scoreboard we actually have right now, and the common-sense questions it forces us to ask.
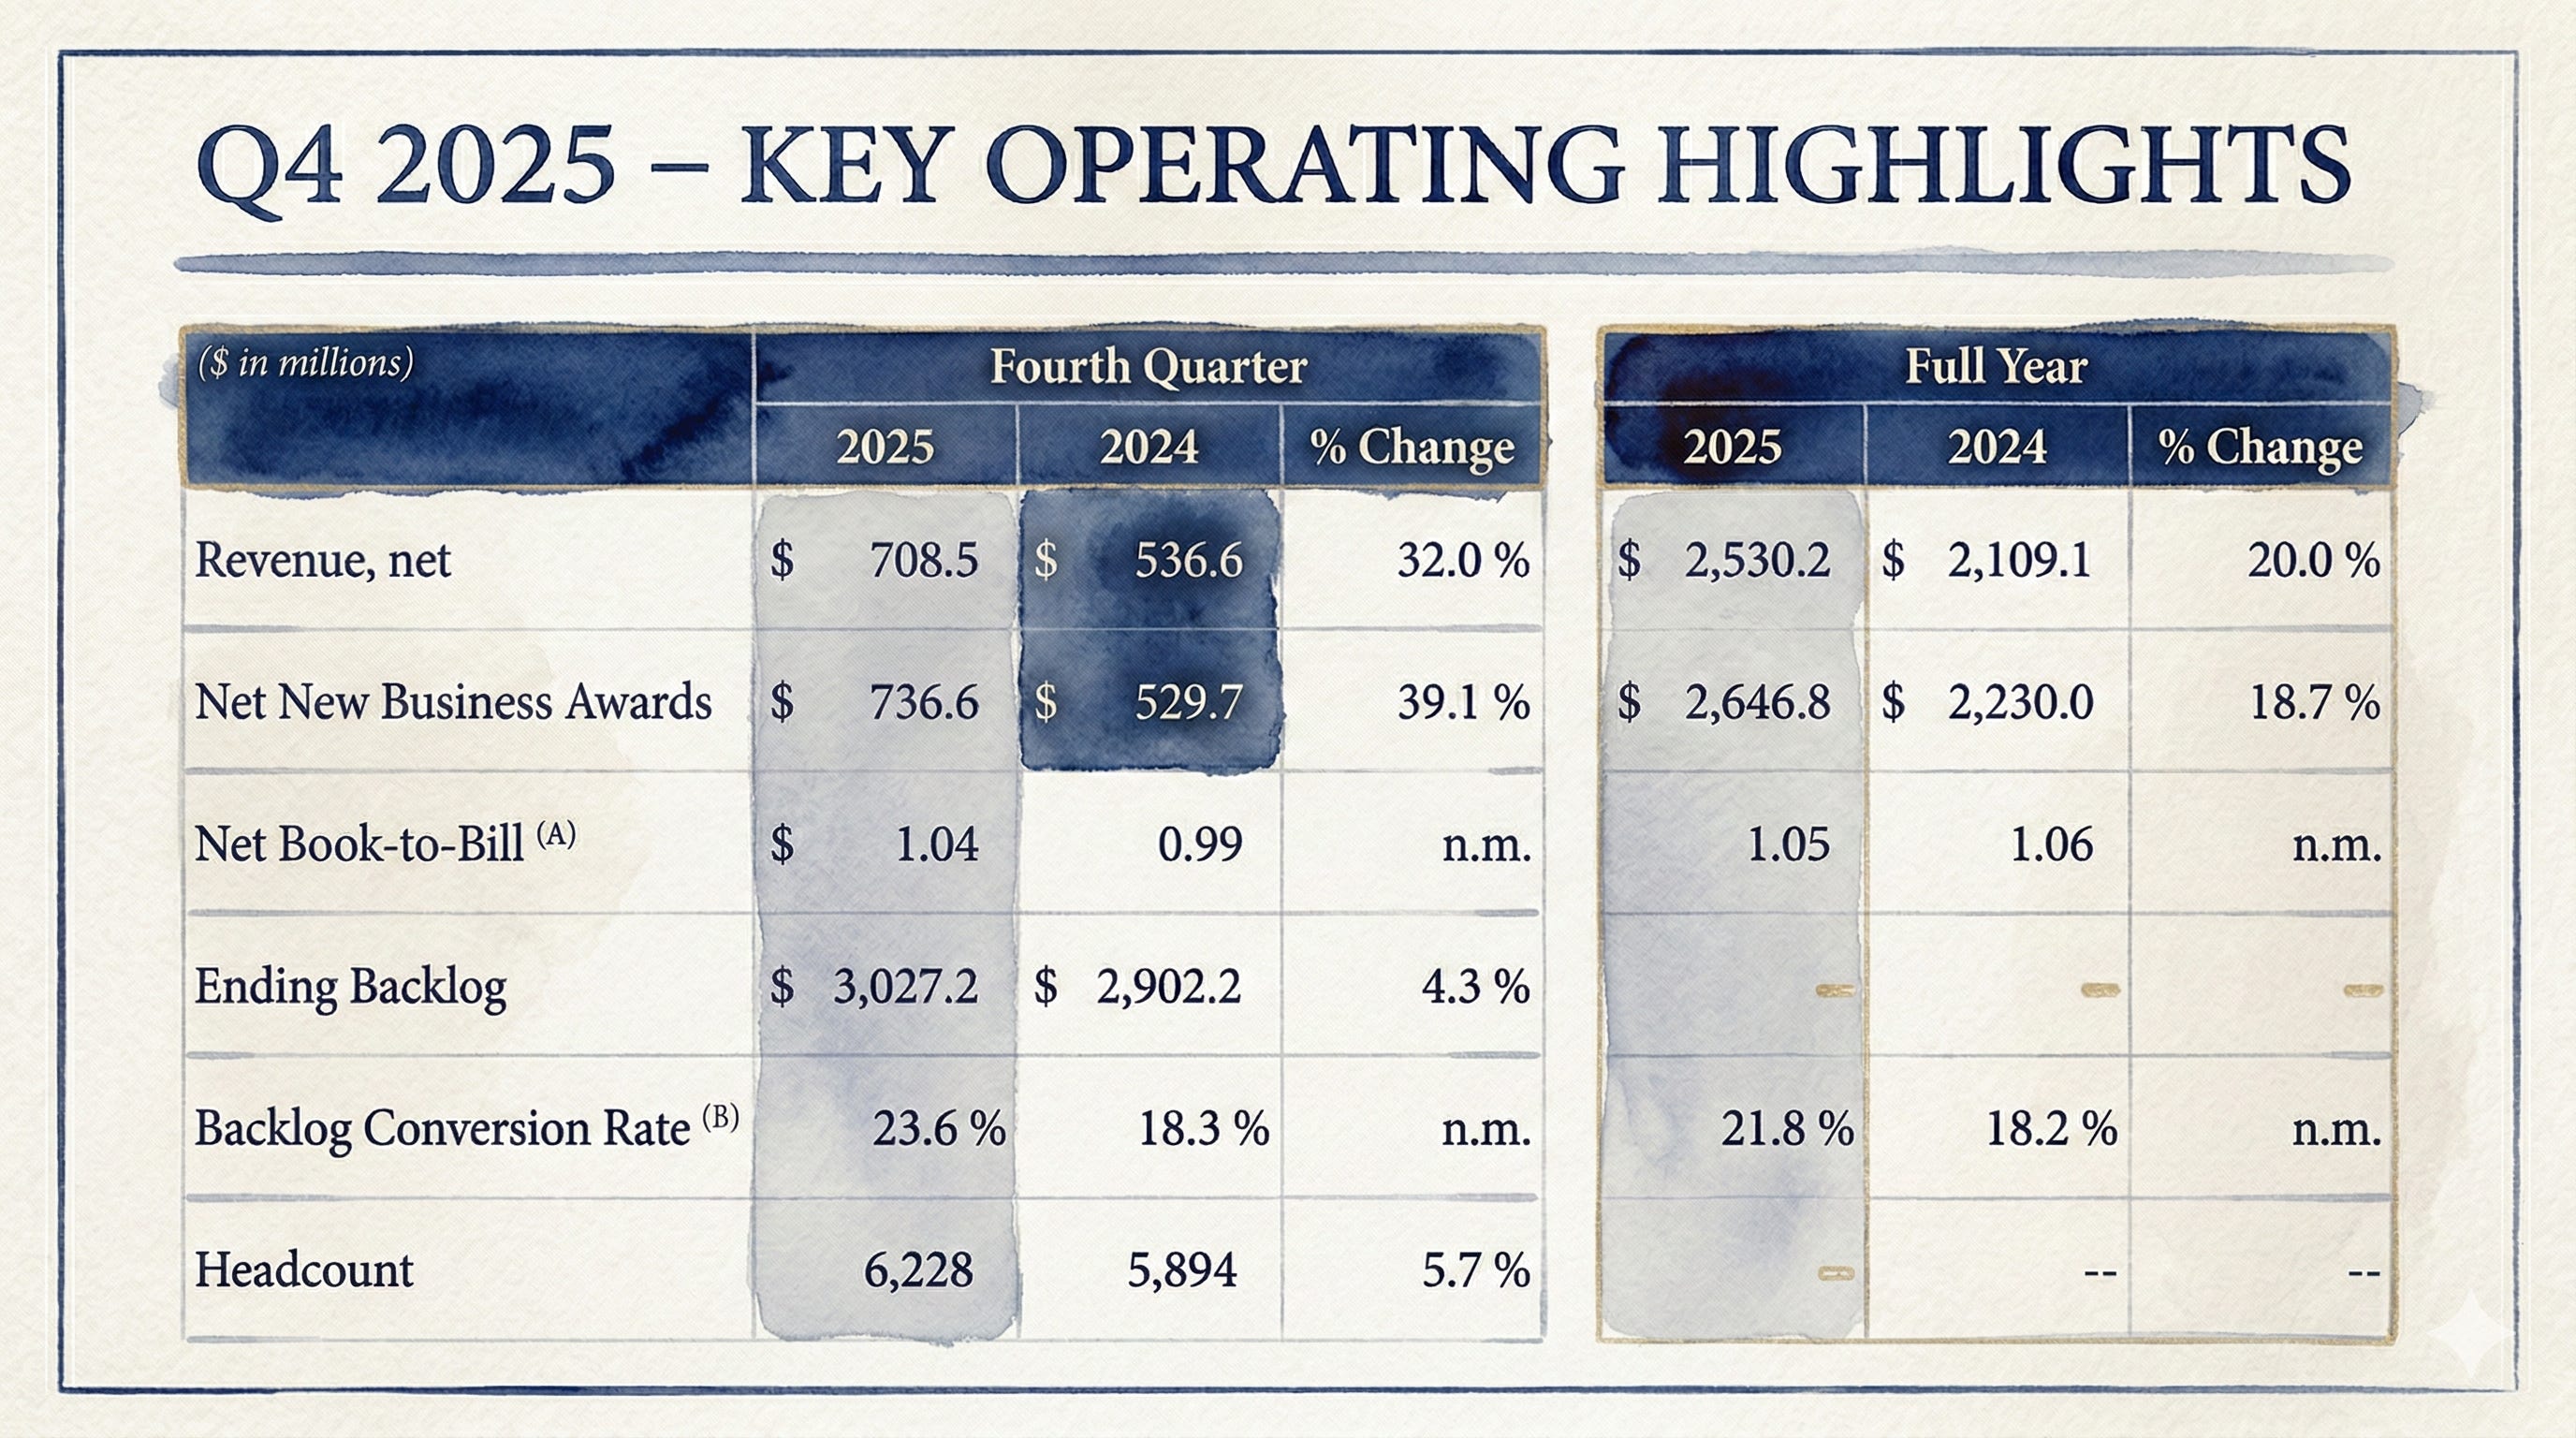
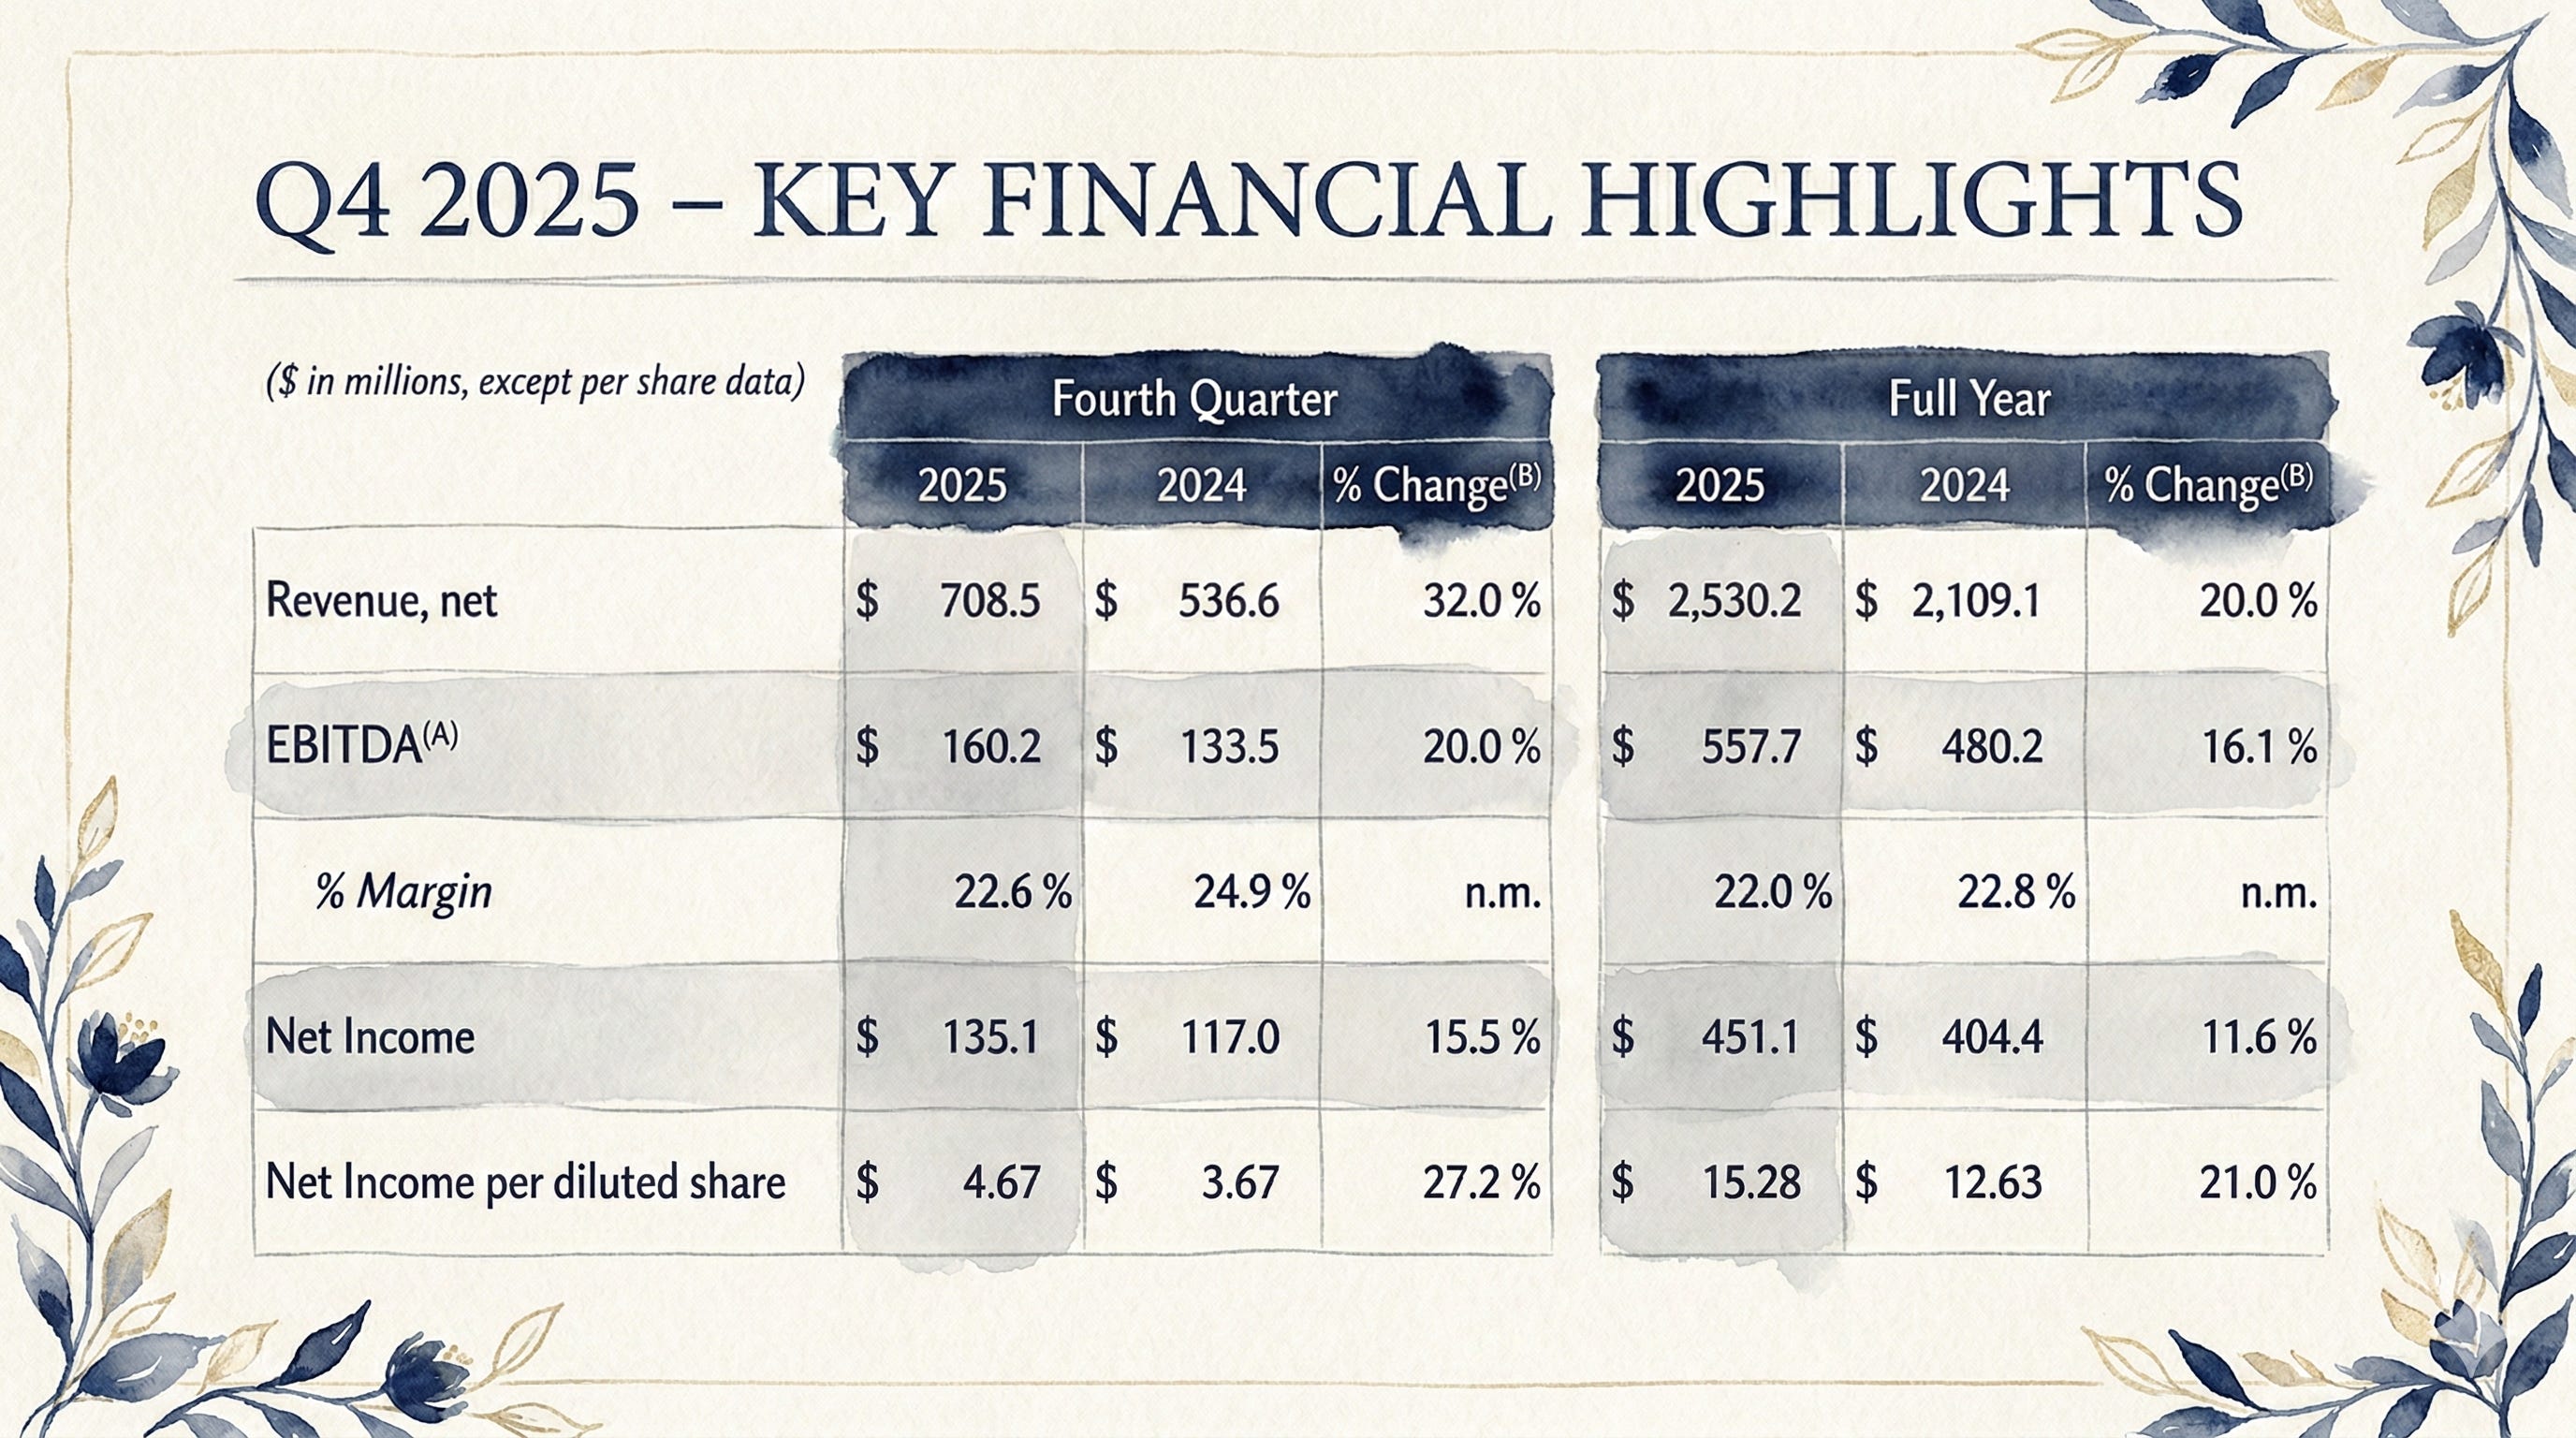
FY2025 revenue was $2,530.2m and net income was a very healthy $451.1m. Net new business awards were $2,646.8m and ending backlog sat at $3,027.2m. Net book-to-bill for FY2025 was 1.05x.
So, what exactly is the market’s underlying argument hiding inside those numbers?
The market worry is incredibly simple, like worrying about your pantry during a snowstorm: FY2025 revenue grew fast, but backlog growth was modest.
If revenue is being fed by backlog conversion rather than fresh backlog replenishment, that growth can keep going… right up until the pantry is empty.
The bull case is equally simple and grounded: backlog conversion rose because Medpace’s execution is fantastic, not because customer demand is weak.
If awards stay healthy and that conversion rhythm remains steady, Medpace can just keep compounding per-share economics.
The bear case is the classic, old-school CRO bear case: demand in this industry is notoriously cyclical, trial sponsors can terminate projects, and the financial pain usually shows up with a frustrating lag.
Add in that founder control and the related-party headlines I mentioned earlier, and the stock’s multiple can compress even if the actual P&L doesn’t implode.
Atomic Take: This is fundamentally a “duration vs price” debate. The underlying business looks exceptionally high-quality, but that $12.82B market cap is underwriting continued excellence and clean optics from here to eternity. Owner yields look more forgiving, but only if buybacks stay funded.
Falsifier: A full-year net book-to-bill falling below 1.00x (company KPI) would be the clearest, cleanest sign that underlying demand is slipping, even if the accounting on the surface still looks totally fine.
Founder & Control-Room
Dr. August Troendle, MD founded Medpace back in July 1992 and has been the CEO and Chairman ever since. Before he built Medpace, he actually worked at the FDA as a Medical Review Officer, and later as a manager at Sandoz (which is now Novartis) focusing on clinical development.
The man knows the bureaucratic maze from the inside out. He also holds an MD from the University of Maryland and an MBA from Boston University.
From a shareholder’s perspective, the point of bringing this up isn’t just to recite biography trivia. It’s all about incentives and control. The company’s 10-K explicitly flags his heavy influence via ownership and control as a core governance factor.
They also separately disclose related-party items, things like the company using CEO-owned lodging and leases, and certain travel services structures.
A recent SEC Form 4 from November 2025 shows Dr. Troendle reported direct sales of shares on 11/24/2025 and 11/25/2025.
Now, he is still reporting substantial direct and indirect beneficial ownership (including massive holdings through Medpace Investors, LLC), so he hasn’t abandoned ship. But when the founder sells, Wall Street notices.
How the Business Actually Makes Money
Medpace sells execution. Specifically: they sell the ability to run incredibly complex clinical trials with fewer nasty surprises, fewer regulatory delays, and fewer “why is this data missing?” moments that make drug developers age in dog years.
Mechanically, CRO economics all come down to three linked plumbing pipes.
Pipe 1: awards. When a trial sponsor officially signs on for work, Medpace records “net new business awards” (a company KPI). That’s the very top of the funnel. The water entering the house.
Pipe 2: backlog. Those awards then become backlog (company KPI), which is simply the reservoir of contracted work that hasn’t yet been recognized as official revenue.
Pipe 3: conversion. Finally, that backlog converts into revenue as the actual work is performed, recognized under their specific revenue recognition model.
That chain matters deeply because Medpace is not selling a simple one-time widget off a store shelf. They are selling complex, multi-period project execution where timing shifts, scope changes, and sudden sponsor decisions can dramatically change the shape of their reported growth.
The customer mix tells you exactly what kind of economic cycle you’re exposed to. By 2024 revenue mix (company classification), they were 79% small biopharma, 17% mid-sized biopharma, and just 4% large pharma.
That is a wonderful, highly profitable place to be when biotech funding budgets are healthy and flowing.
And it’s a completely jittery, nerve-wracking place to be when the funding taps dry up.
Now, here is the “don’t get fooled by the top line” part of the story.
In FY2025, Medpace had $1,037.5m of reimbursed out-of-pocket expenses.
Now, that is very real revenue under GAAP accounting, but economically, it behaves a lot more like pass-through spend (like reimbursing an employee for a flight) than it behaves like “we raised our prices and got rich.”
If pass-through spending rises, total revenue rises. That does not automatically mean the underlying service economics of the business improved one bit.
The Audit: Reimbursed out-of-pocket revenue can turn standard growth charts into a highly flattering funhouse mirror. It’s not fake money, but it’s certainly not proof of a widening moat, either. If you want to truly understand whether Medpace is getting better at its job, watch the operating income and the cash conversion, not just the total revenue fireworks.
Finally, there’s a subtle balance-sheet tell that’s incredibly easy to ignore if you’re skimming: advanced billings.
Medpace often receives customer cash well in advance (recorded as contract liabilities/“advanced billings”), which helps brilliantly to reduce credit risk and support their working capital. That’s a fundamentally good, sound operational design, but it also means their cash position can look “extra strong” in periods where advanced billings happen to rise.
Atomic Take: The true moat here is their operational integration and execution reliability, but you have to judge that moat through awards/backlog conversion, operating profit, and cash generation, not through flashy top-line growth.
Falsifier: Ending backlog falling year-over-year (as of Dec 31) while revenue still manages to grow would heavily imply that the cash flywheel is being fed by drawing down the backlog pantry, not by replenishing it.
What Went Wrong
Let’s be clear: nothing “went wrong” in the sense of a broken business. The wheels didn’t fall off.
What went wrong is the strict setup for future expectations: FY2025 delivered a very strong year on paper, but some of the underlying KPIs raise the legitimate question of how much of that success was “conversion intensity” (working faster) versus actual “demand acceleration” (getting more work).
FY2025 revenue was $2,530.2m, up sharply year-over-year. Ending backlog, however, was $3,027.2m, which was only up modestly.
And importantly, the backlog conversion rate rose to 21.8%, up from 18.2%.
The other part of the puzzle is capital allocation.
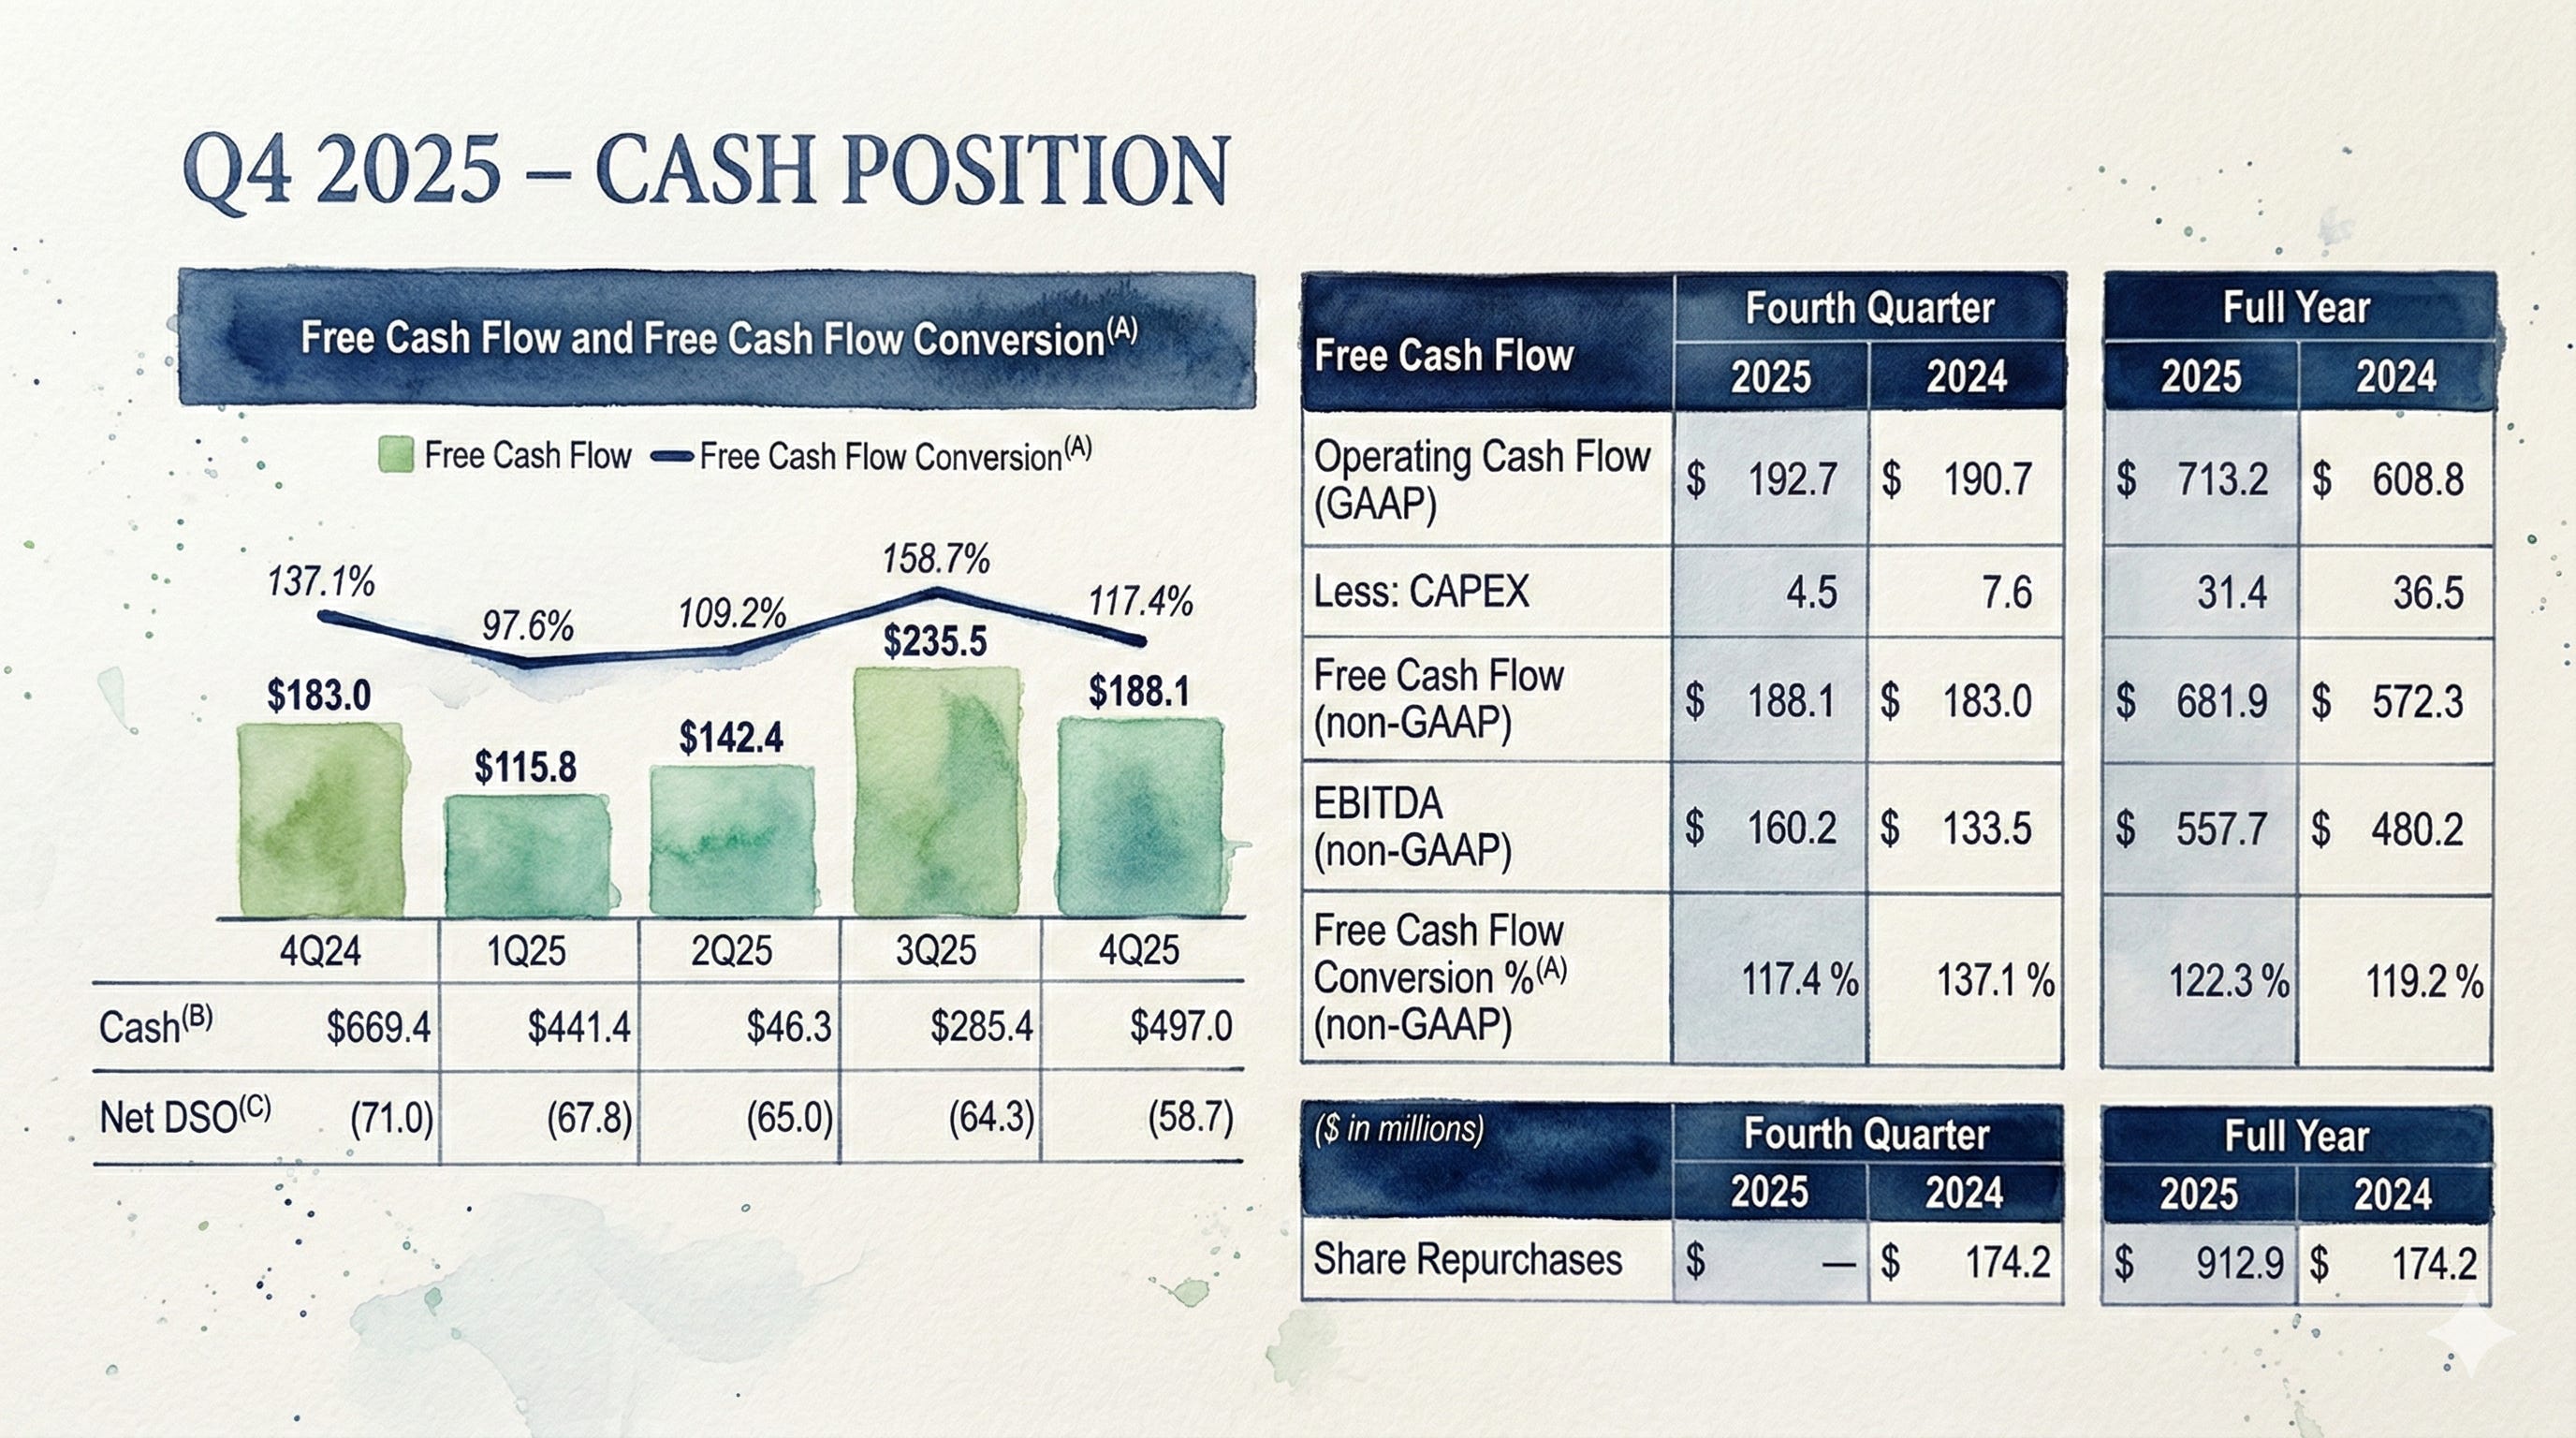
They aggressively repurchased $912.9m of shares in FY2025, with another $821.7m still authorized for buybacks.
Cash and cash equivalents ended the year at $497.0m.
Big buybacks can be a phenomenal use of capital, but when the stock screens expensive on headline multiples, they can also read as ‘we’re paying up just to retire shares,’ which makes the market hypersensitive to any hint of a cycle wobble.
Then you’ve got the governance cloud. It’s the kind of thing that doesn’t just disappear just because the income statement behaves itself for a few quarters.
The CEO/founder controls about 19.0% of outstanding shares.
Rebound Catalysts
Alright, this isn’t some distressed turnaround checklist where we’re praying for a miracle. Medpace isn’t broken.
This is a proof checklist. We just need them to prove to Wall Street that the engine is still humming normally.
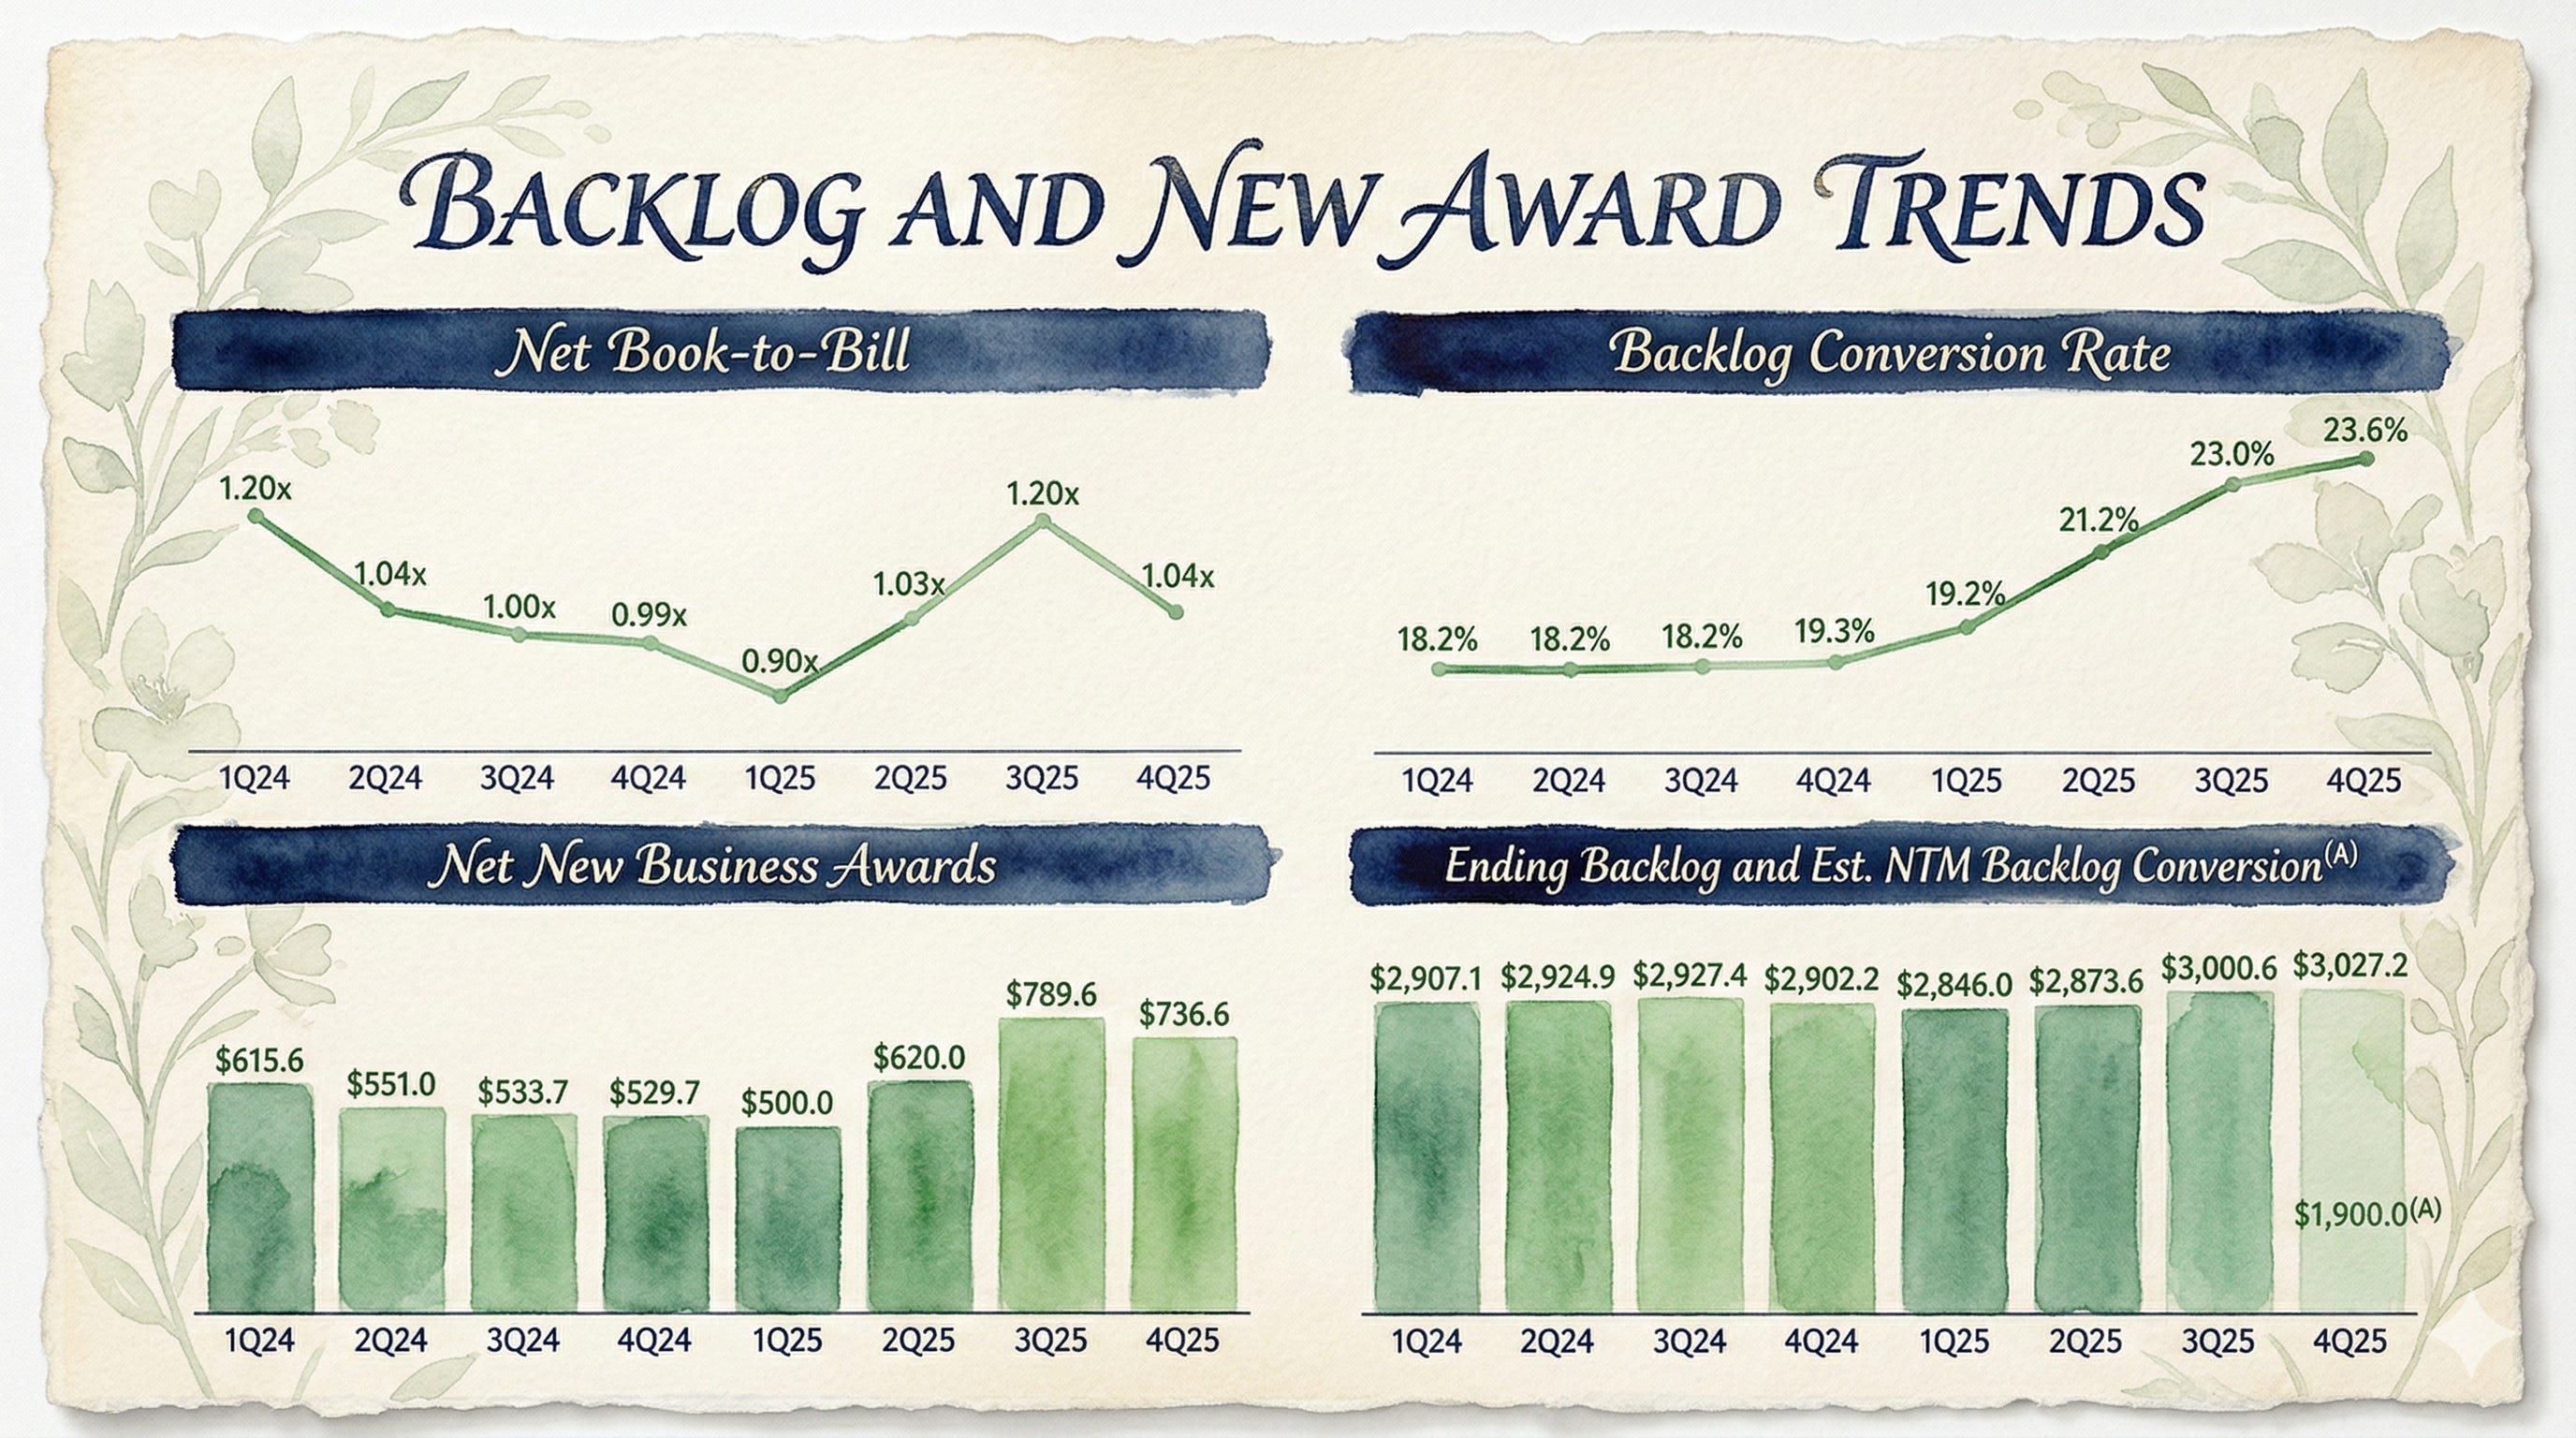
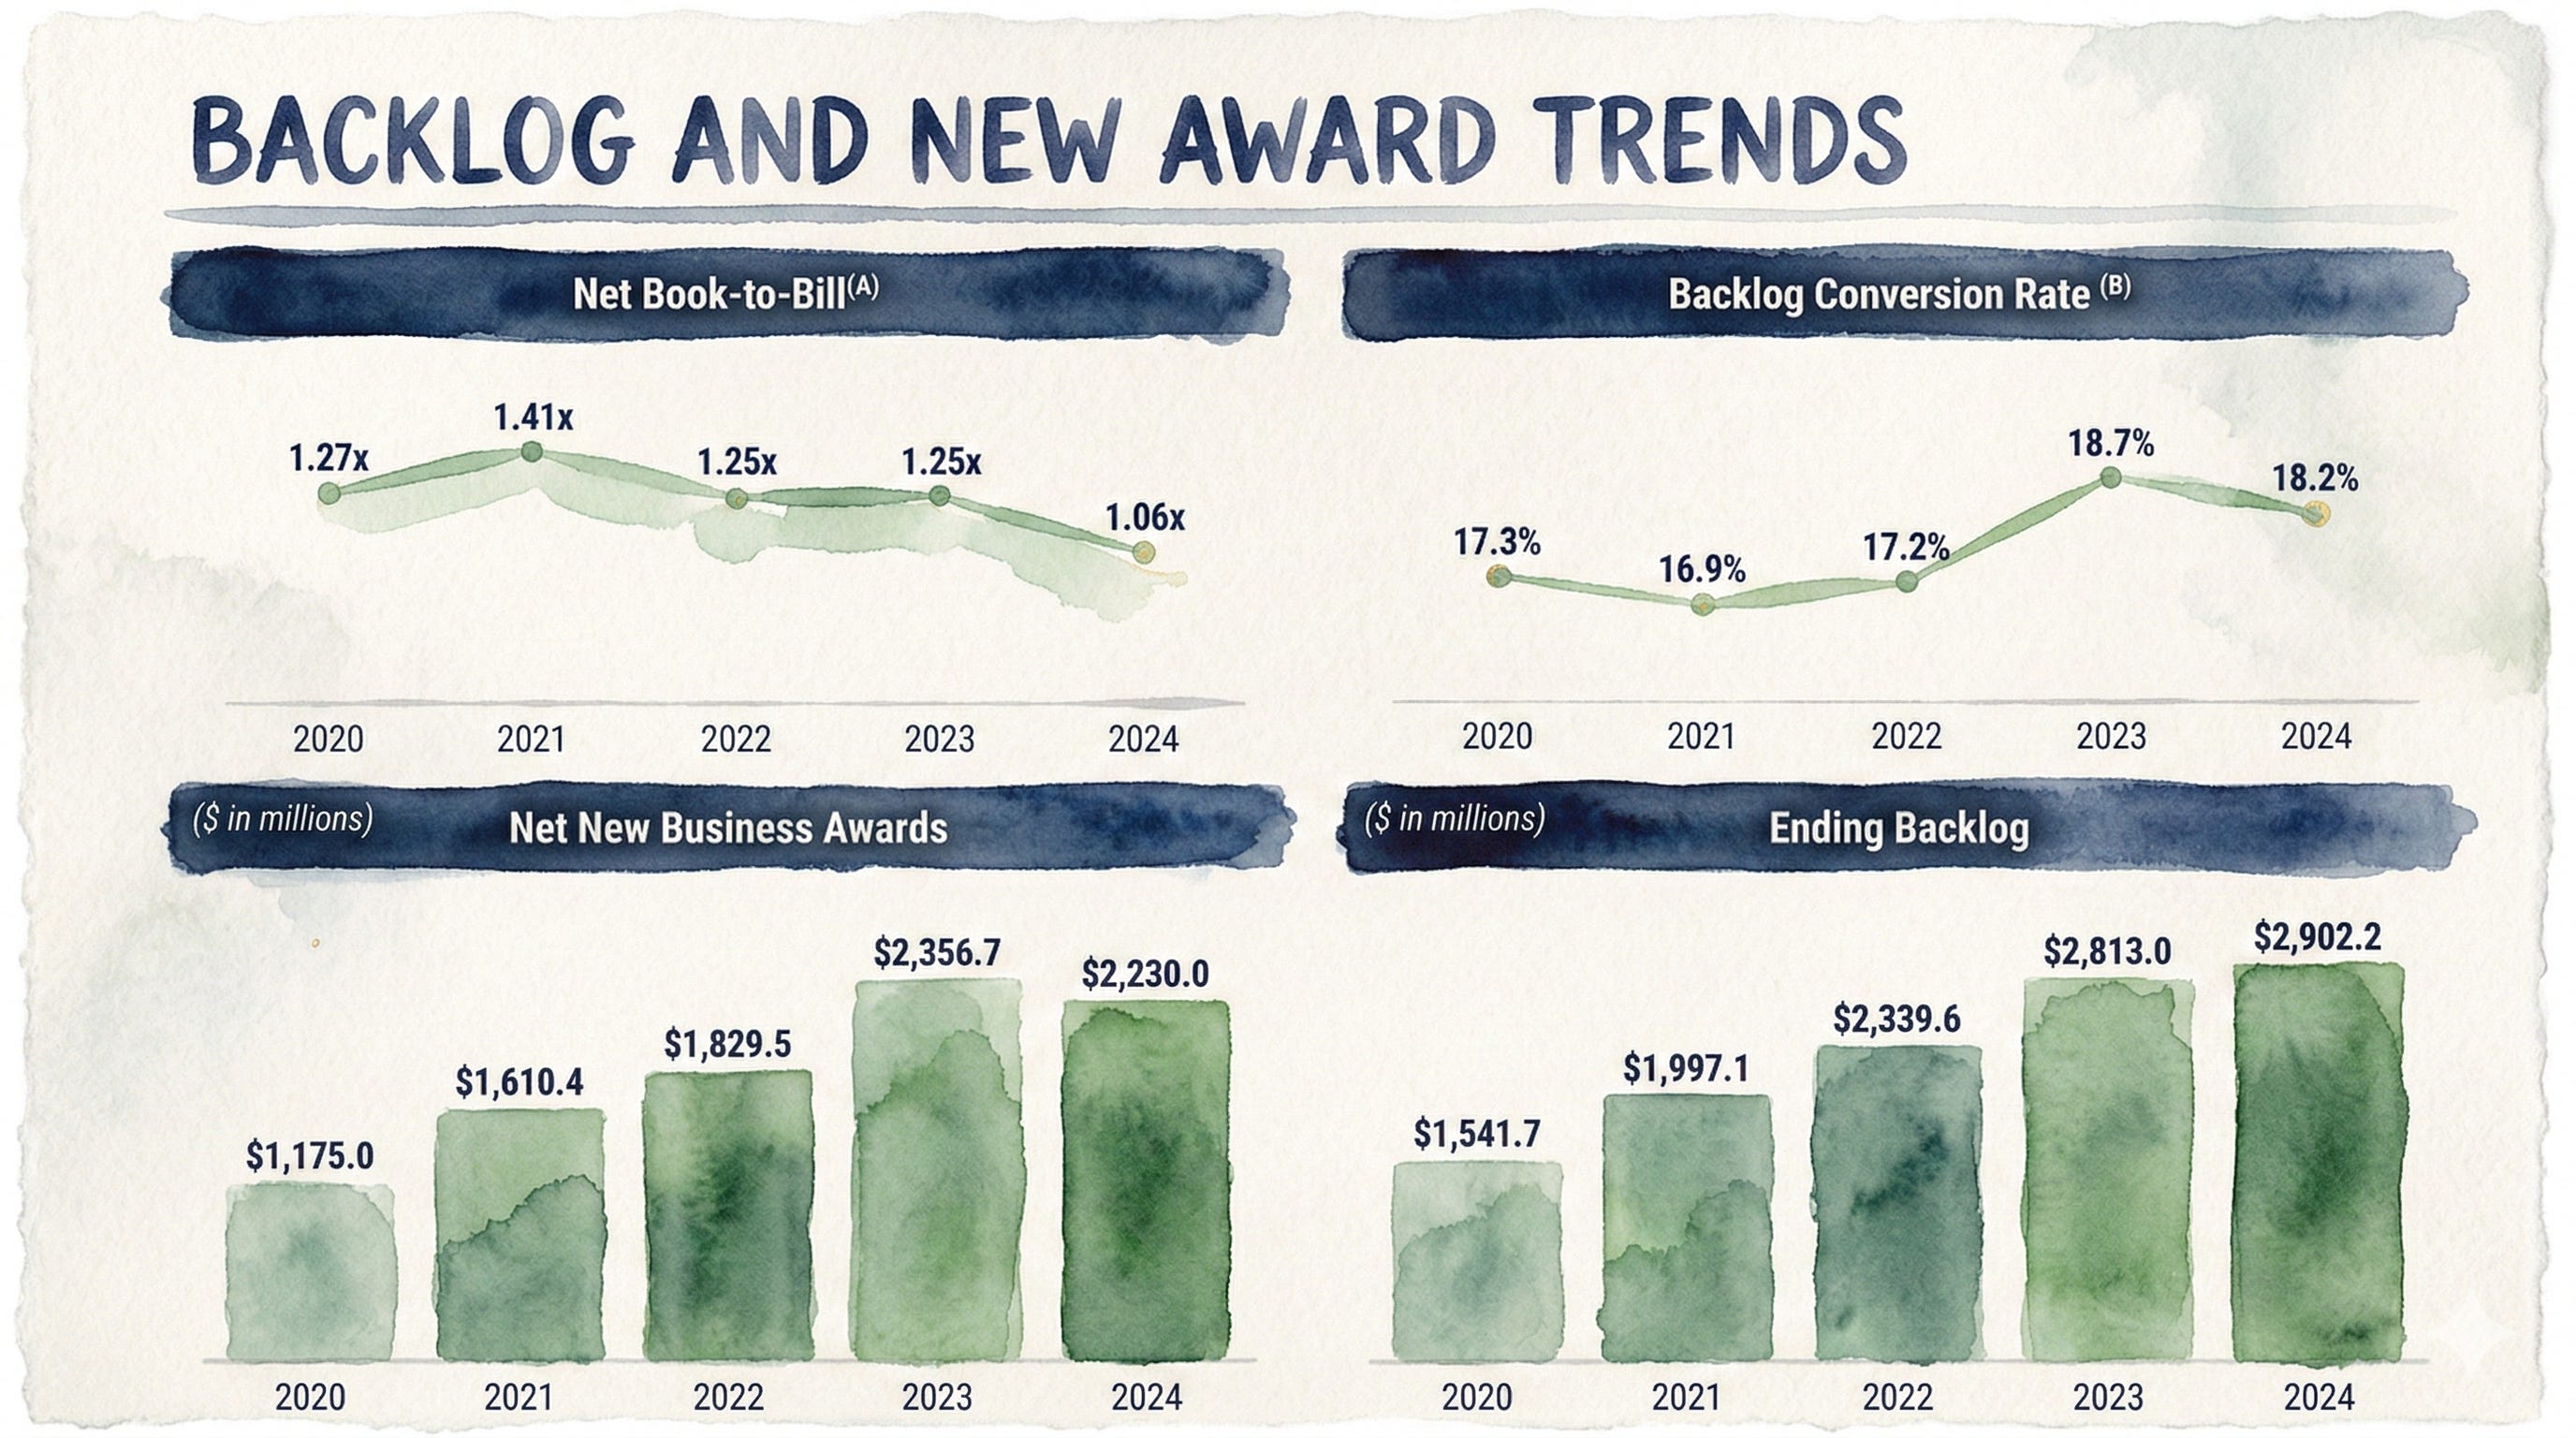
Catalyst 1: book-to-bill climbs. Think of book-to-bill like a bathtub. Awards are the water from the faucet; revenue is the water going down the drain. FY2025 net book-to-bill was 1.05x (company KPI), meaning the water is still rising, but barely.
A sustained improvement here would be the cleanest, simplest signal that new awards are outpacing revenue in a durable way. I want to see that tub filling up.
Catalyst 2: backlog growth re-accelerates. Ending backlog was $3,027.2m (as of Dec 31, 2025). That’s our reservoir of future earnings.
If this backlog starts growing faster than the low-single-digit pace implied by FY2025, the whole “we have a massive future runway” narrative improves overnight. Wall Street loves a long runway.
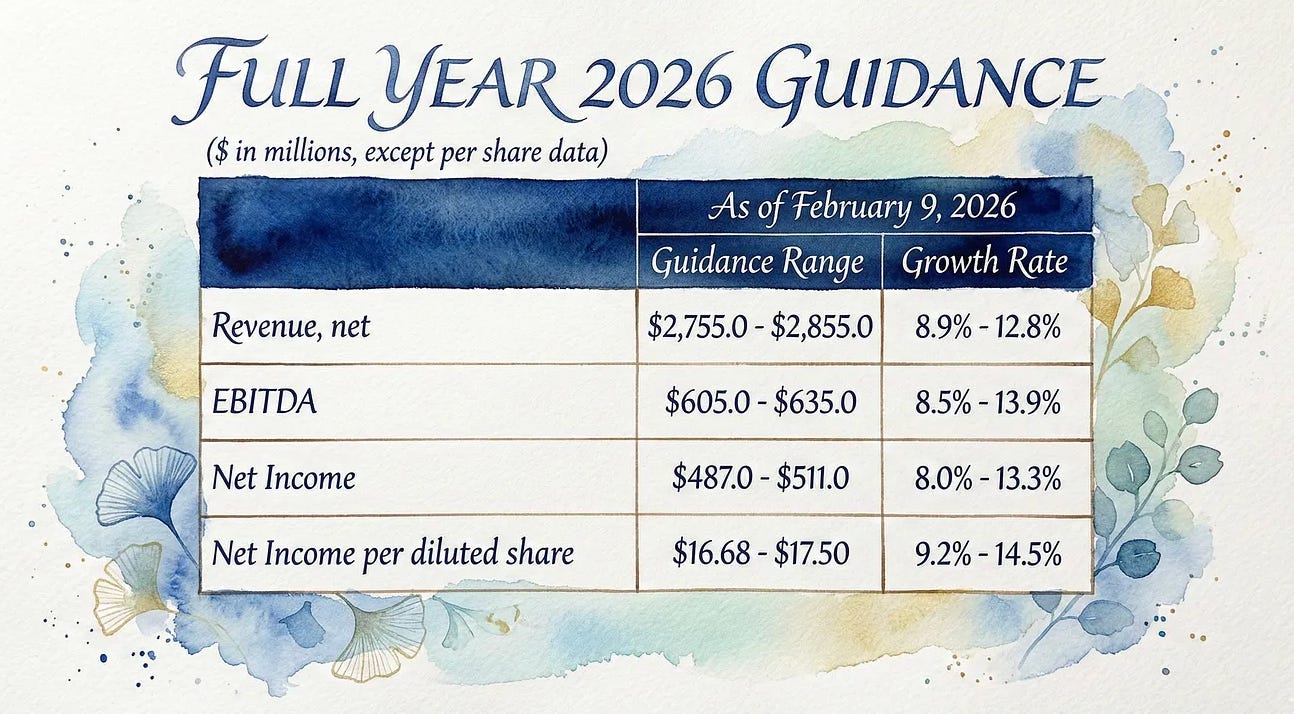
Catalyst 3: 2026 conversion visibility holds. The company laid their cards on the table: they disclosed an expectation that $1,890.0m–$1,910.0m of backlog would convert to revenue in 2026.
That is a beautiful chunk of locked-in visibility. If that conversion stays steady while new awards remain strong, the dreaded “biotech cycle risk” starts looking incredibly manageable.
Catalyst 4: guidance lands inside the box. FY2026 guidance calls for revenue $2,755.0m–$2,855.0m and net income $487.0m–$511.0m.
Here is a secret about high-expectation stocks: the market doesn’t always need a massive, hero-level beat. It just needs boring, predictable reliability. Hit the numbers. Don’t cause a fuss.
Catalyst 5: cash stays boring too. FY2025 operating cash flow was a massive $713.2m. If cash generation remains this strong without relying on unusually favorable working-capital magic (which we’ll discuss below), that’s an absolute credibility amplifier. Cash in the bank is a fact; everything else is an accounting opinion.
Atomic Take: The so-called “rebound” here is simply awards and backlog proving to the market that FY2025 wasn’t just a one-year backlog conversion party.
Falsifier: Two consecutive quarters of net book-to-bill falling below 1.00x (company KPI) would be an early-warning air raid siren that the next shoe is dropping. If the tub is draining faster than it fills, you eventually run out of water.
Financial Quality Rubric
Profitability (4/5)
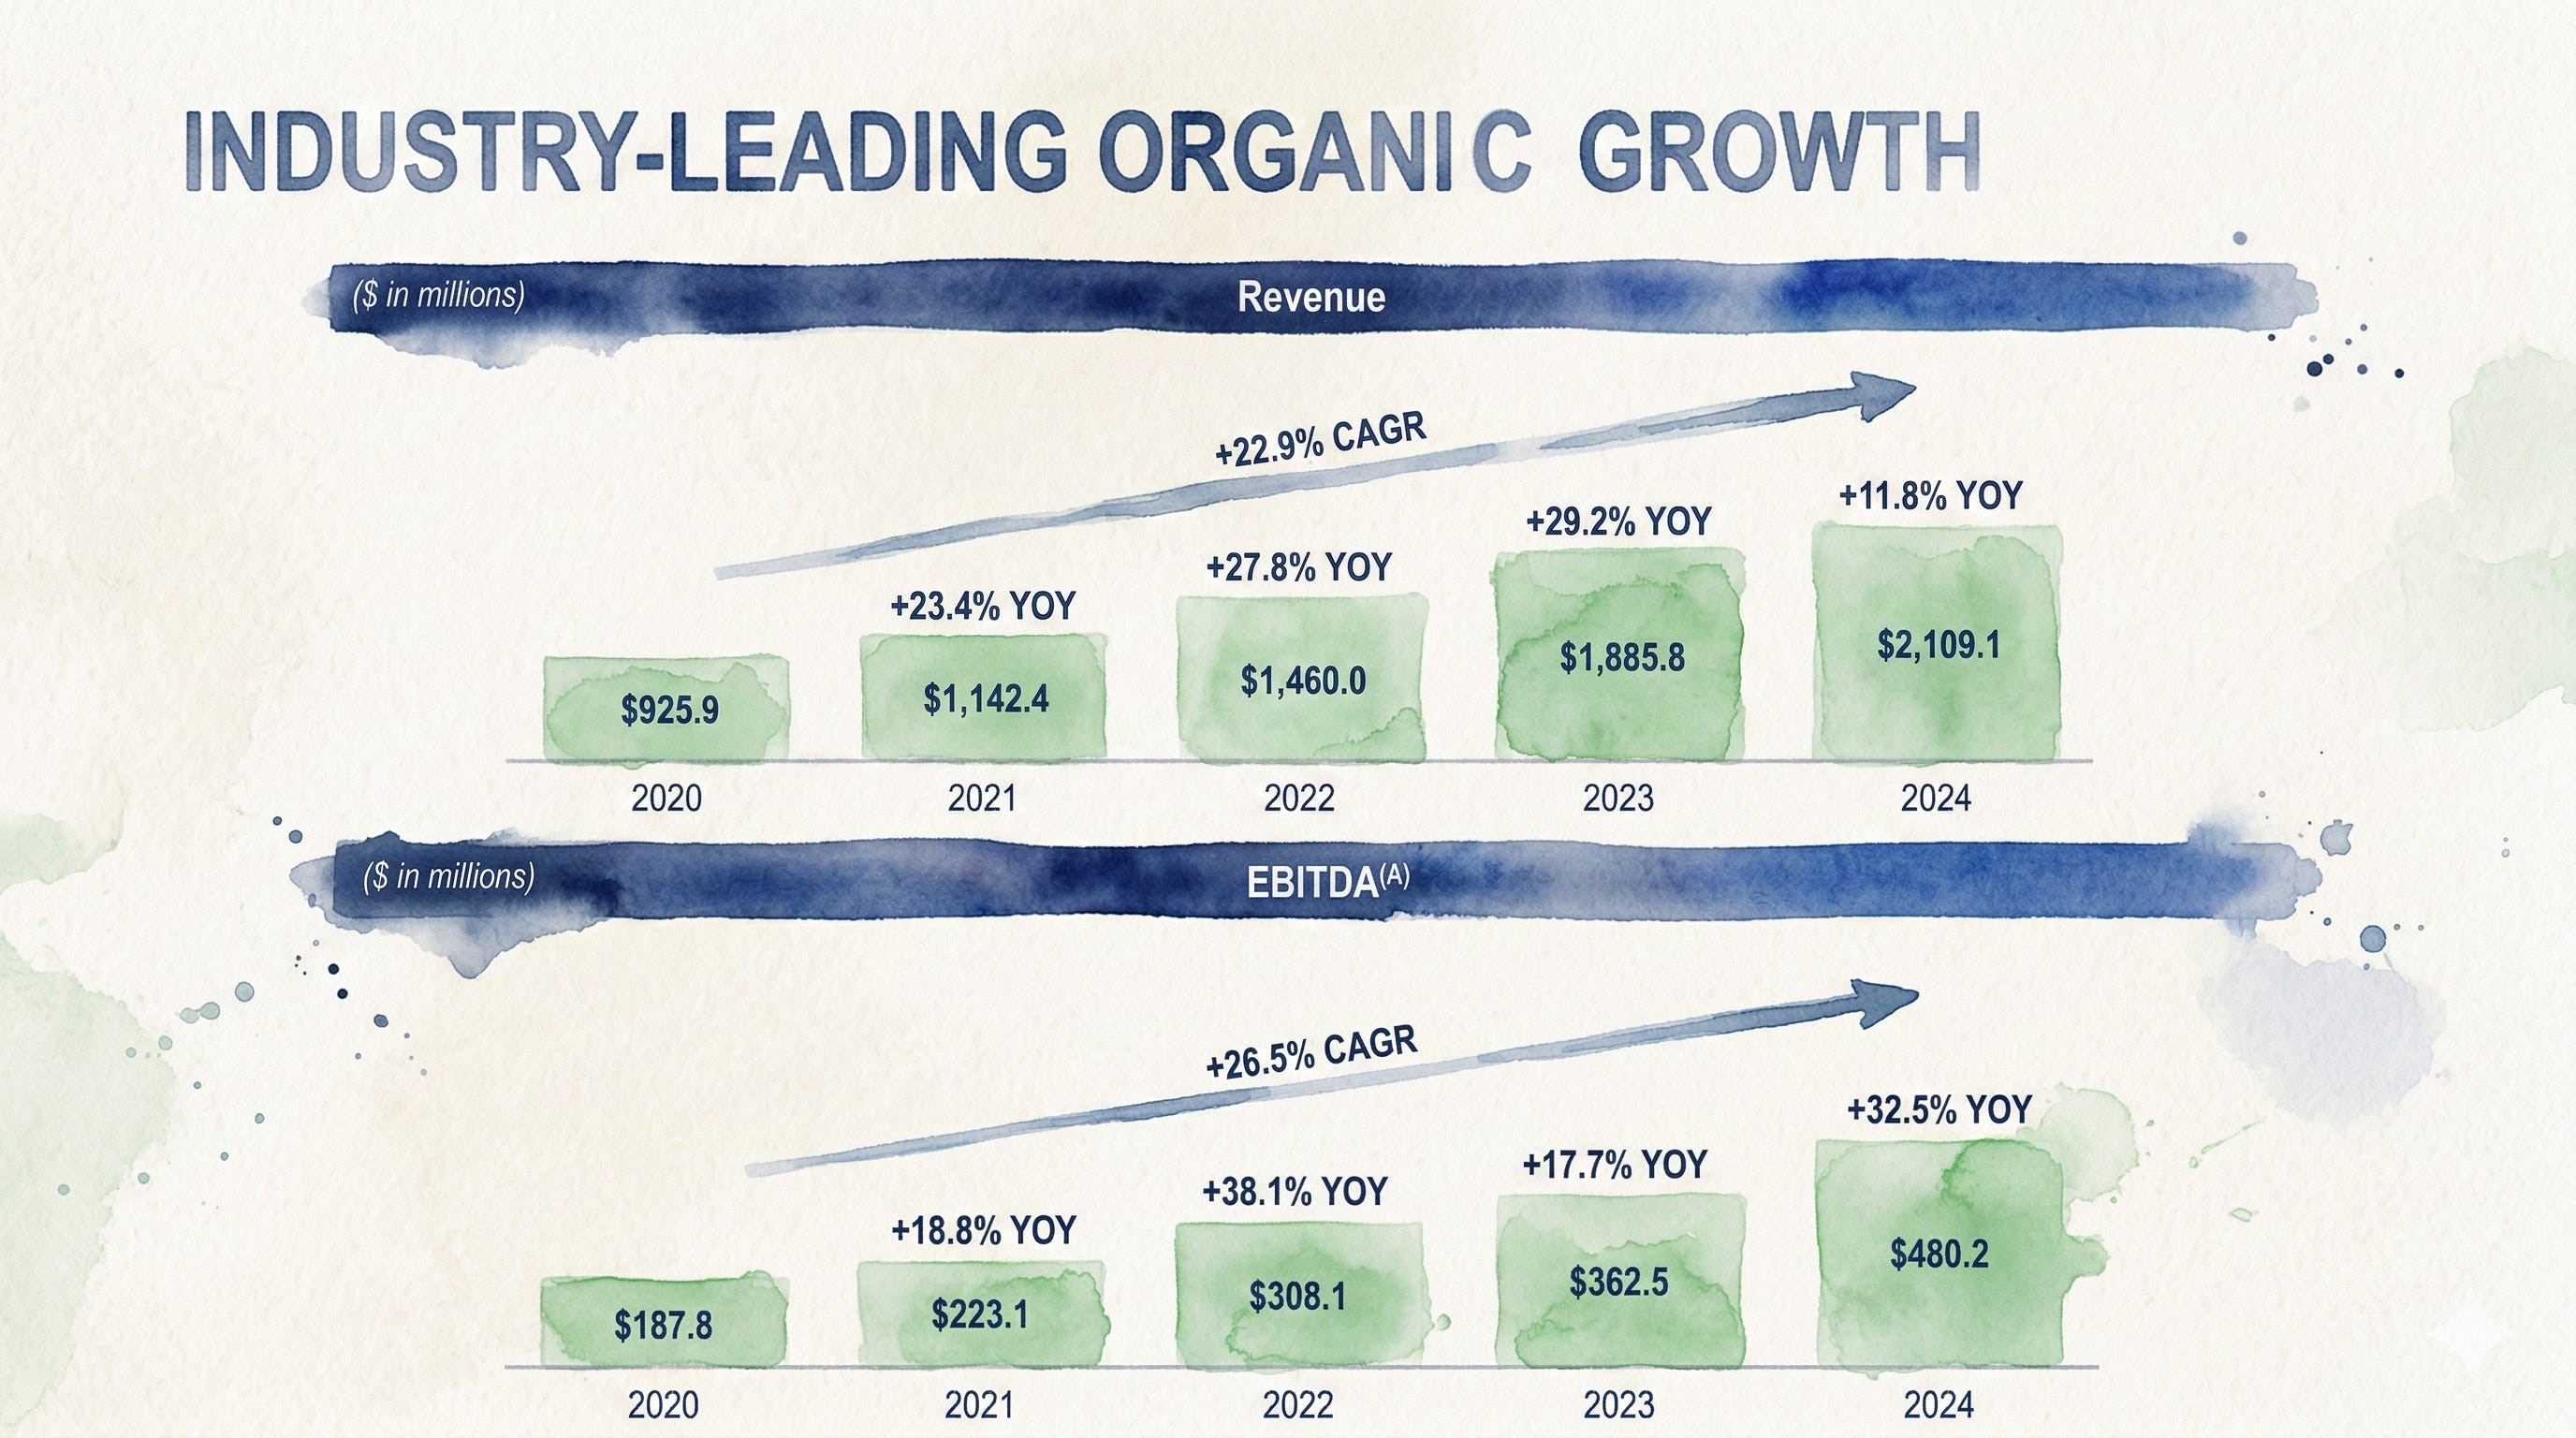
FY2025 income from operations was $534.9m on revenue $2,530.2m. Run the math, and that implies an operating margin around 21%. Let me be clear: that is premium services economics.
You don’t get a 21% operating margin in a highly competitive industry unless you are exceptionally good at what you do.
Growth quality (4/5)
FY2025 delivered very strong growth. But remember, the key quality question in the CRO business is not simply “did it grow?” — it’s “was that growth actively replenished by new awards, or was it just pulled forward by burning through the backlog?” Right now, it’s a mix, which is why we deduct a point.
Cash conversion (4/5)
FY2025 operating cash flow was $713.2m versus a net income of $451.1m. That is spectacularly strong conversion. However, some of that boost is tied to working-capital timing. We’ll separate the genuine fuel from the temporary turbo down below.
Balance sheet resilience (4/5)
There is absolutely no long-term debt outstanding (as of Dec 31, 2025) and they carry meaningful cash. The liabilities they do have skew toward operational obligations rather than dangerous financial leverage. This is the kind of balance sheet that lets you sleep soundly at night during a recession.
Governance & alignment (3/5)
Founder ownership is usually a massive positive for alignment. I want the captain heavily invested in the ship. But control combined with related-party disclosures can, and often will, keep a persistent valuation discount on the equity. It just makes institutions nervous.
Capital allocation discipline (3/5)
Share buybacks were huge in FY2025. Buying back your own stock can be incredibly shareholder-friendly, but it also violently increases the importance of not overpaying for it. If you buy high, you’re destroying value, not creating it.
Atomic Take: These financial statements read exactly like a premium operator should read. The only deductions are the durability uncertainty (the biotech cycle) and the optics (the governance cloud).
Falsifier: Operating margin compressing materially away from that ~21% zone (derived) while book-to-bill hovers near a stagnant 1.0x would strongly suggest real competitive or cost pressure is building, not just harmless cycle noise.
The Statements

Balance Sheet (The Geiger Test)
As of Dec 31, 2025, cash and cash equivalents were $497.0m, total assets were $1,975.5m, and total liabilities were $1,516.4m.
A major, vital part of their current liabilities is advanced billings (also called contract liabilities) of $854.4m (as of Dec 31, 2025). That’s customer cash received before the work is recognized as revenue. In plain English: their biotech sponsors are pre-funding a meaningful slice of the Medpace engine. Warren Buffett loves insurance float; I love operational float. It’s free money to run the business.
Stop & Think: When your customers pay you before you do the work, who is actually financing your growth? Hint: It isn’t the bank.
Accrued expenses were $408.4m (as of Dec 31, 2025). On the asset side, goodwill sat at $662.4m. I don’t mind goodwill as long as the underlying earnings power of those past acquisitions stays durable and real.
The clean, common-sense takeaway: this is absolutely not a balance sheet built on dangerous financial leverage. It’s built on operational float. That is incredibly valuable, but it’s also directly linked to the health of client demand and project cadence.
Atomic Take: This balance sheet is operationally pre-funded rather than financially levered. It’s a massive strength that only becomes a risk if biotech sponsor behavior suddenly shifts and they stop paying up front.
Falsifier: Advanced billings falling sharply while accounts receivable/unbilled rises (both as of Dec 31) would be a huge red flag indicating weakening prepayment dynamics and potentially much higher collection risk.
Cash Flow (The Turbine)
Start with the adult reconciliation.
FY2025 net income was $451.1m. FY2025 operating cash flow was $713.2m. That is a massive spread. Why did cash flow dwarf net income so heavily?
A key contributor was simply working capital shifting in their favor: advanced billings increased by $143.8m, and accrued expenses increased by $97.1m. This was partially offset by an increase in accounts receivable and unbilled of $106.2m. When you collect cash before you pay bills, your cash flow looks like a superhero.
Now, let’s look at “capex-like” spending. Property and equipment expenditures were just $31.1m. This is a wonderfully asset-light business. Using a conservative proxy, a sustainable free cash estimate can be Operating Cash Flow minus those PPE purchases: roughly $681.9m.
They also present a non-GAAP free cash flow figure of exactly $681.9m, which lines up beautifully with our simple proxy.
And then, we have the big cash outflow: share repurchases of $917.4m. That’s the entire turbine output (and then some) getting shoveled straight into per-share math.
Atomic Take: The cash turbine is undeniably strong, but part of the extra torque this year comes from working-capital timing — and buybacks are aggressively consuming most of the cash generated.
Falsifier: A year where operating cash flow suddenly falls below net income without a clear, logical timing explanation would signal either a nasty working-capital reversal or structurally weaker cash economics.
Income Statement (The Reactor)
FY2025 revenue was $2,530.2m. Income from operations was $534.9m. Net income was $451.1m. Diluted EPS came in at a beefy $15.28.
But the revenue composition is what prevents lazy investors from making bad conclusions.
Direct service costs (excluding D&A) and reimbursed out-of-pocket expenses are the large line items here. Crucially, those reimbursed out-of-pocket expenses were a massive $1,037.5m.
If you want to think clearly about this business, you absolutely must separate their actual “service margin engine” from the “pass-through volume” of reimbursements.
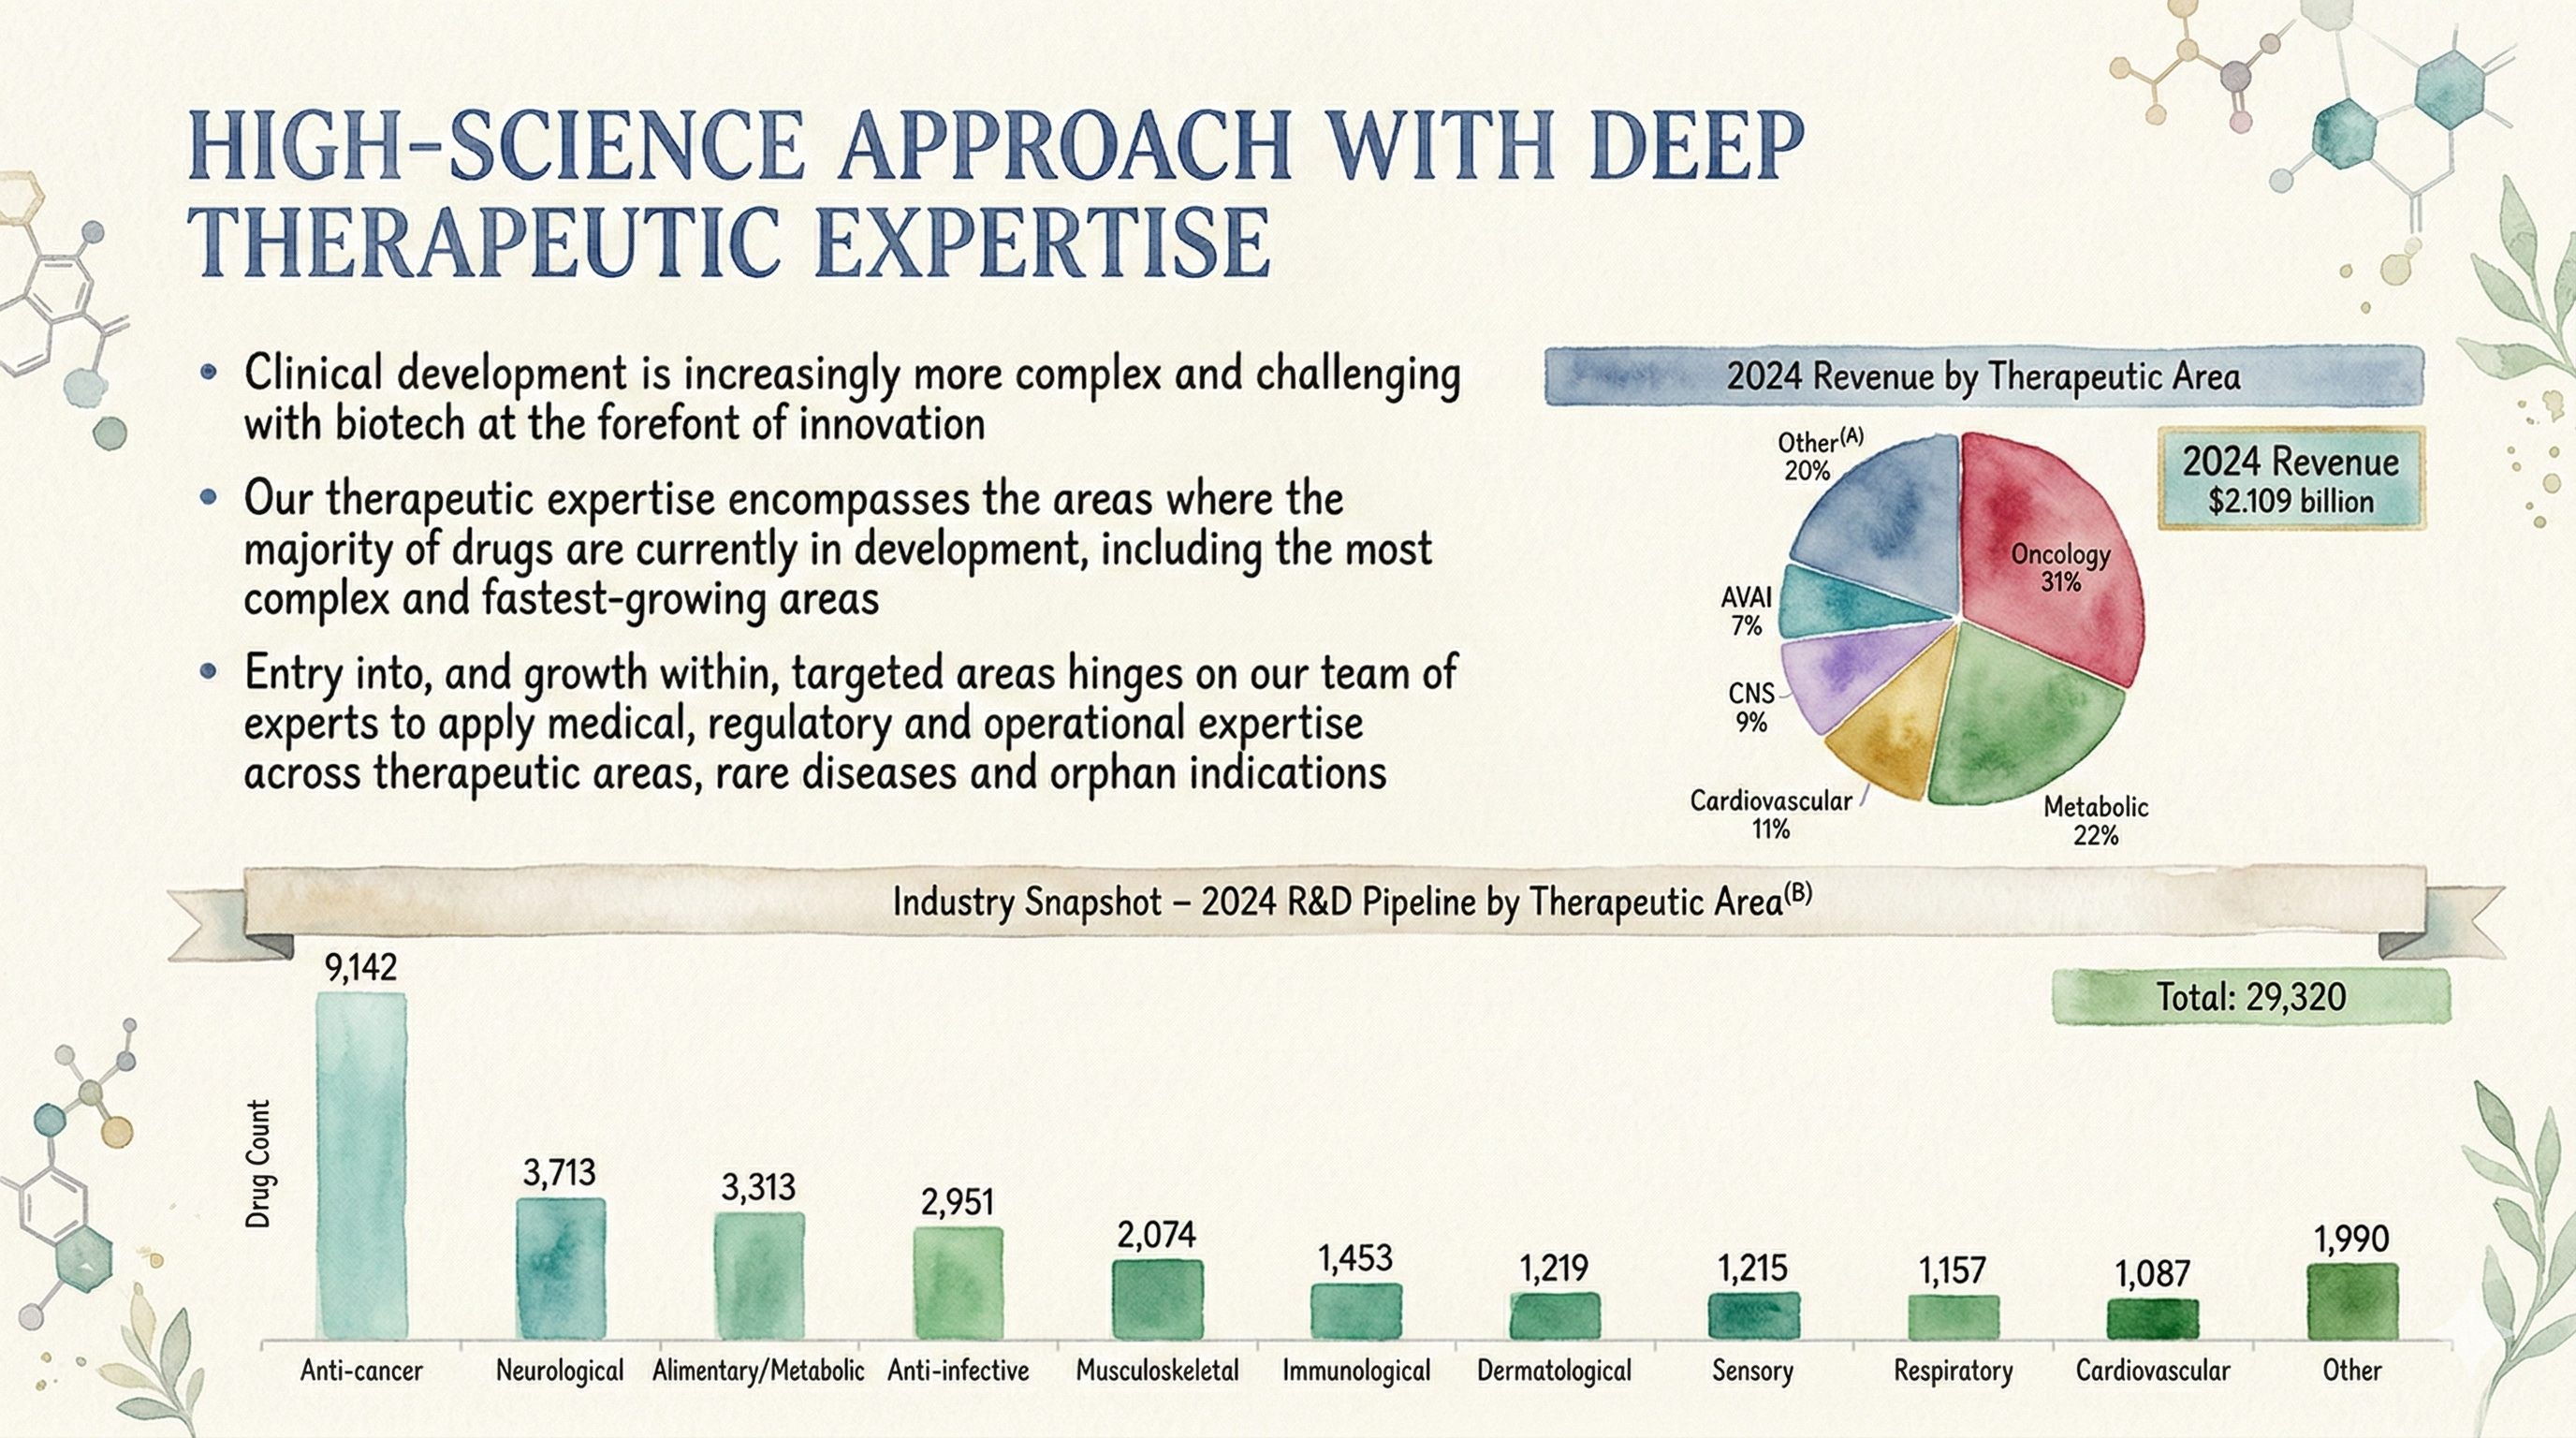
Therapeutic mix shows a heavy concentration in areas where biotech spending tends to be highly meaningful. FY2025 oncology revenue was $747.6m and metabolic was $745.0m, with other therapeutic areas contributing the remainder. They are fishing in the ponds where the biggest fish live.
Atomic Take: The reactor runs incredibly hot on operating profit and cash — but that top-line growth needs careful interpretation because massive pass-through revenue can severely inflate the optics of growth.
Falsifier: EPS declining year-over-year while revenue somehow still rises would point directly to mix deterioration or hidden cost creep hiding behind the smokescreen of pass-through growth.
Valuation (The Terry Smith Lens)
Let’s get down to brass tacks. You can love a business to the moon and back, but if you pay the wrong price, it will still break your heart.
At the time of writing, the share price is $451.75. They generated FY2025 diluted EPS of $15.28.
I am using the exact shares outstanding of 28,381,283 (as of Feb 6, 2026, shares).
Multiply the shares by the price, and that implies a total equity value of about $12.82B (derived: price × shares).
That is the sticker price for the entire farm today. Now we have to figure out if the soil is rich enough to justify it.
Quality Gate
Before we even talk about whether the stock is expensive, we have to ask if the business is actually any good. Investors like Terry Smith don’t buy junk, and neither do we.
FY2025 income from operations (EBIT) was a massive $534.9m on total revenue of $2,530.2m.
If you run the math, that gives you an ~21.1% EBIT margin.
Let me translate that into plain English: a 21% margin in a highly complex services business means your customers desperately need you, and you are executing without dropping the ball.
FY2025 operating cash flow was $713.2m. Meanwhile, the money they actually had to spend to keep the lights on and the labs running—property & equipment expenditures—was a tiny $31.1m.
Atomic Take: Quality absolutely clears the gate here. This is a high-margin operator with serious, undeniable cash generation. They aren’t just making accounting profits; they are making cold, hard cash.
Falsifier: A full-year period where operating cash flow drops below net income without a very clear, temporary timing explanation (like a weird working capital or tax shift).
Owner Yields (The “what do owners get?” question)
Earnings yield:
If we look at standard earnings, the FY2025 earnings yield = EPS $15.28 / $451.75 = 3.38%.
Flip that upside down, and that’s a ~29.56x trailing P/E (derived). If you only look at that one number, you might choke on your coffee and call it too expensive.
FCF yield:
But earnings are an opinion; cash is a fact.
FCF ≈ operating cash flow of $713.2m minus PPE purchases of $31.1m = $682.1m.
If we take that FCF yield ≈ $682.1m / market cap $12.82B, we get 5.32%.
Stop & Think: Why is there almost a two-point spread between the earnings yield and the cash yield? Because this business requires almost zero capital to grow. They get paid in cash, and they keep the cash.
So, if you’re looking strictly at the “earnings multiple,” you’ll instantly call it expensive.
But if you’re looking at the actual “cash yield” they generate, it already starts to look significantly less premium and a lot more reasonable.
Atomic Take: On a pure owner-earnings basis, the stock looks meaningfully more attractive than the P/E headline suggests, entirely because their cash conversion is incredibly strong.
Falsifier: That cash proxy yield falling materially while the earnings multiple stays stubbornly elevated.
Capital Return Yield
This is where the story gets aggressive.
FY2025 share repurchases were a staggering $912.9m (USD) for 2,961,924 shares, with $821.7m still authorized for future buybacks (as of Dec 31, 2025, USD).
If you map that out, the buyback yield ≈ $912.9m / $12.82B = 7.12%.
But here’s the crucial reality check, the thing most investors miss: those buybacks actually exceeded the FCF proxy by about $230.8m. That “extra” return wasn’t magic. It was funded by actively reducing their cash on hand and shifting other balance sheet movements.
This matters deeply for how we frame the valuation:
If buybacks continue anywhere near this FY2025 intensity, the per-share claim on earnings and cash can rise incredibly quickly (the share count retired is ~10% of year-end shares, proxy-derived). That is a monster tailwind.
However, if buybacks are forced to revert to “FCF-funded only” because the savings account runs low, the buyback yield could be lower. But even then, it would still be potentially very meaningful given that strong ~5.3% FCF yield.
Atomic Take: If you treat your “owner return” as FCF yield plus sustainable net buybacks, the whole setup can look fairly decent in terms of value, even with a high level P/E on the surface. But only if the buyback machine remains credibly funded by recurring cash flow, not by simply drawing down the balance sheet until it hurts.
Falsifier: Repurchases slow down materially while the book-to-bill/backlog weakens (a nasty two-hit combo: less per-share support from buybacks, and less operating momentum from the business).
Insider Incentives
Wall Street loves to talk about “alignment,” but usually, it’s just a CEO with a few stock options. Not here.
The CEO/founder’s ownership is, as I stated earlier, officially disclosed at approximately 19.0% of outstanding shares (as of Dec 31, 2025).
When you own nearly a fifth of the company, it creates an unusually direct, burning incentive to heavily favor per-share compounding (aggressive buybacks, ruthless spending discipline, and fierce margin defense).
Yes, it also increases the control and optics risk we talked about earlier — but strictly on the topic of incentives: this is absolutely not a “hired-gun CEO paid in vibes” situation. He eats his own cooking.
Atomic Take: The entire incentive stack is brutally aligned with per-share outcomes, which makes this massive buyback program much more than just a corporate PR stunt.
Falsifier: Any SEC disclosure indicating a meaningful change or reduction in founder ownership/control, or a sudden, unexplained shift away from buybacks as the primary capital return mechanism.
Why Now?
At $451.75, here is exactly what you’re getting:
A 3.38% GAAP earnings yield.
A healthy 5.32% FCF yield.
A massive 7.12% buyback yield
So the verdict is this:
