


This deep dive is perfect listening for your next walk. And also: drop it into NotebookLM and let it generate audio overviews, infographics, and summary reports from the analysis. It’s a great way to absorb the key ideas without staring at a screen. Enjoy!
Some of this post is free to read. If the research is useful to you, consider becoming a Founding Member while the offer is still open.
The standard rate is $199/year. Founding members lock in $99/year, permanently, for as long as you stay subscribed.
There are currently 3 spots left for this offer. When the spots are gone, they are gone.
As a paid subscriber, you get:
Full Deep Dives & Valuation Teardowns: the comprehensive work that takes a full weekend to build. The 18-check framework applied in full, owner earnings DCF, conviction score, and the inversion checklist.
Forensic Balance Sheet Analysis: looking under the hood for what others miss.
The Live Multibagger Index: the highest-signal opportunities, tracked in real time.
Portfolio & Watchlist: exactly how I allocate capital and what is currently in my investing universe.
FINS: earnings numbers broken down clearly, without the noise.
Everything else (Money Mind, Simple Truths, Titan Test, and all deep dives published to date) stays free.
Alright, let’s get to it!
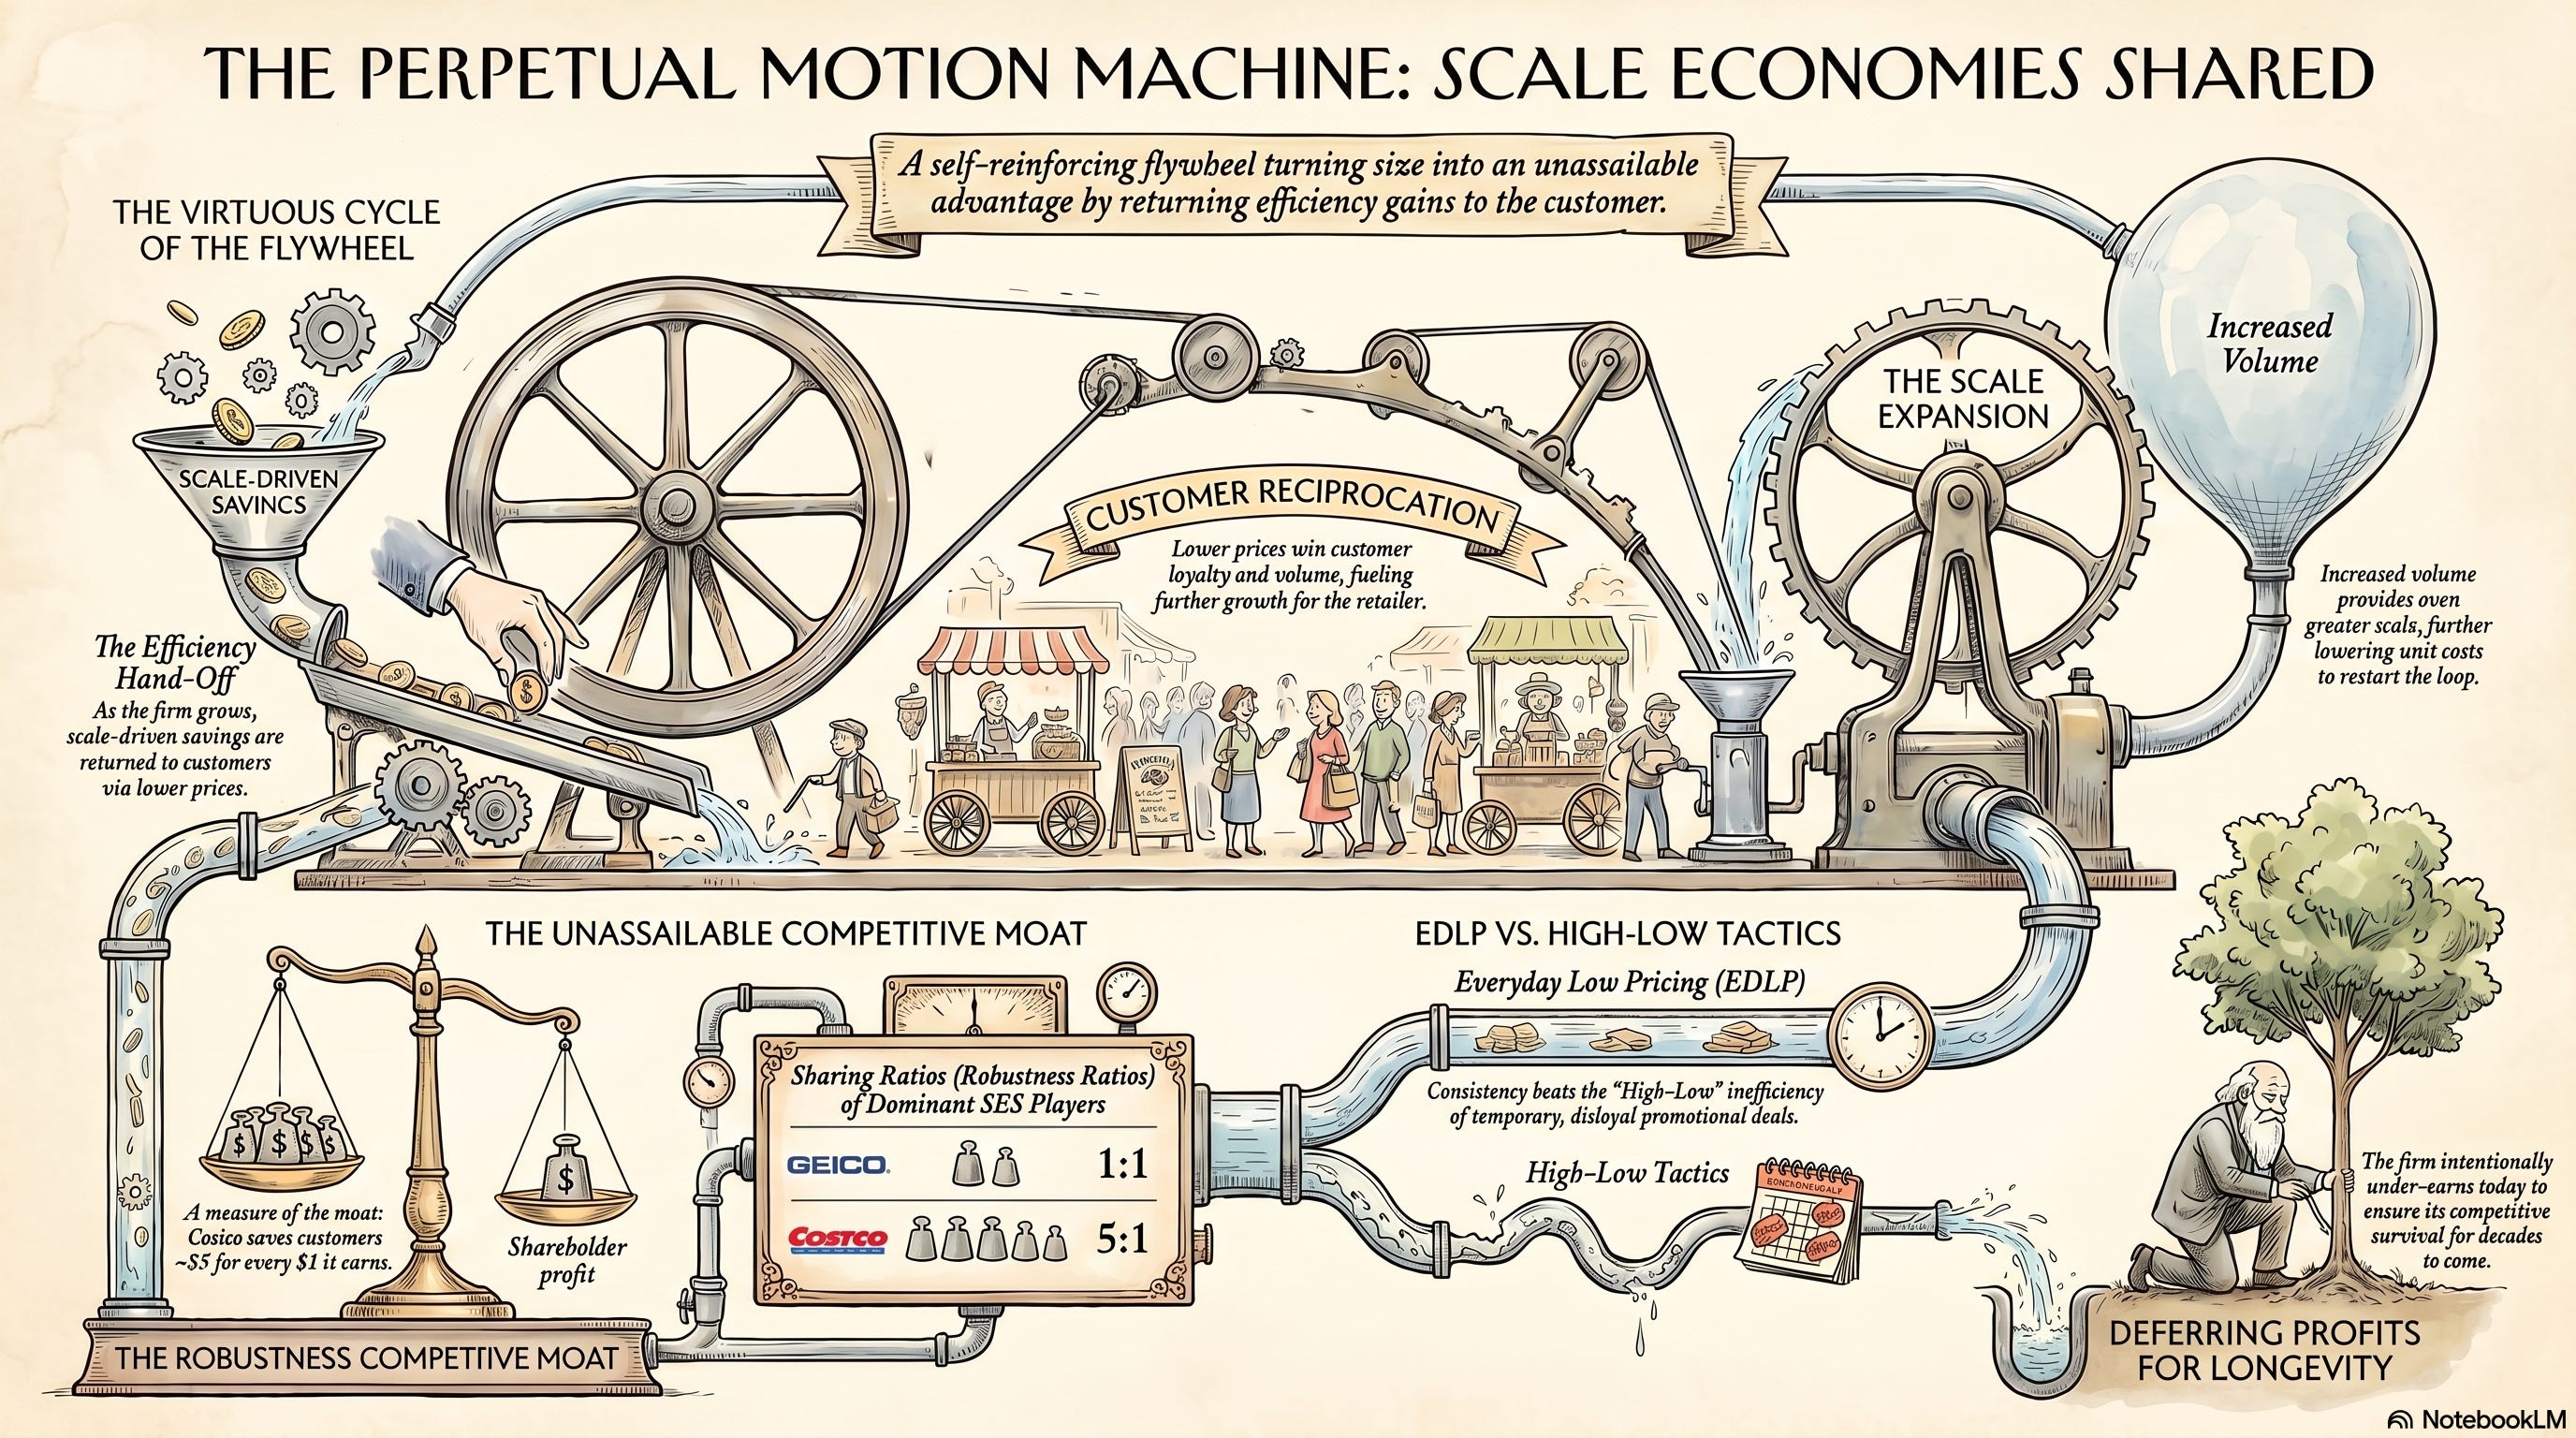
I have had Nu on my radar for a very long time. If you’ve spent any time studying the legendary investor Nick Sleep, you know his framework of “Scale Economies Shared”, and NU is one example of a business that uses this model.
Scale Economies Shared is the idea that a company can win permanently by relentlessly dropping its unit costs and handing those savings right back to the consumer to lock in terminal loyalty. Costco did it. Amazon did it.
But admiration is one thing; entry price is another.
In a hyper-growth credit story, discipline is the only thing that keeps you from getting blown up.
So I watched, I modeled, and I waited. Recently, the market finally served up a price level I actually quite like: $12.29 per share. So I initiated a decent position.
Now that I have real skin in the game, it’s time to pressure-test the thesis. If you are a shareholder, or thinking about becoming one, you have to get comfortable with the structural tension of this business.
Let’s break down exactly what we are dealing with.
If You’re In a Rush
What they do: Nu is a digital financial services juggernaut. They monetize their massive user base through three primary engines: Credit Income ($3,173.3m), Float Income ($1,383.0m), and Fee Income ($759.1m), according to their Q1’26 managerial metrics.
Why it’s hated: Wall Street looks at Nu and sees a “credit book” first, and a “software-like platform” second. Because of that, every single quarter turns into a tense courtroom trial over credit quality, non-performing loans (NPLs), and risk-adjusted economics.
What fixes it: Keeping the core flywheel spinning. We want to see Average Revenue Per Active Customer (ARPAC) march higher than its current $15.9, and the Efficiency Ratio stay glued near its incredible 18% mark, all without late-stage delinquencies re-accelerating from the current NPL 90+ rate of 6.5%.
Atomic Position: I currently hold a long position with a cost basis of $12.29 per share. Because of that, you should treat my optimism the same way you’d treat a package carrying a tiny, polite amount of radiation. Do your own homework.
Atomic Take: Nu’s story is a beautiful compounding flywheel that is forced to operate under a harsh credit-cycle spotlight 24 hours a day, 7 days a week.
Falsifier: If the NPL 90+ metric starts trending upward for multiple consecutive quarters from its current 6.5% base, the entire “controlled credit machine” narrative shatters.
The Setup
Nu’s own presentation of their business is almost insultingly tidy.
They show you a beautifully simple equation: take a rapidly growing customer base, monetize them at higher rates over time, run it all on a highly scalable low-cost platform, and watch it translate into massive earnings.
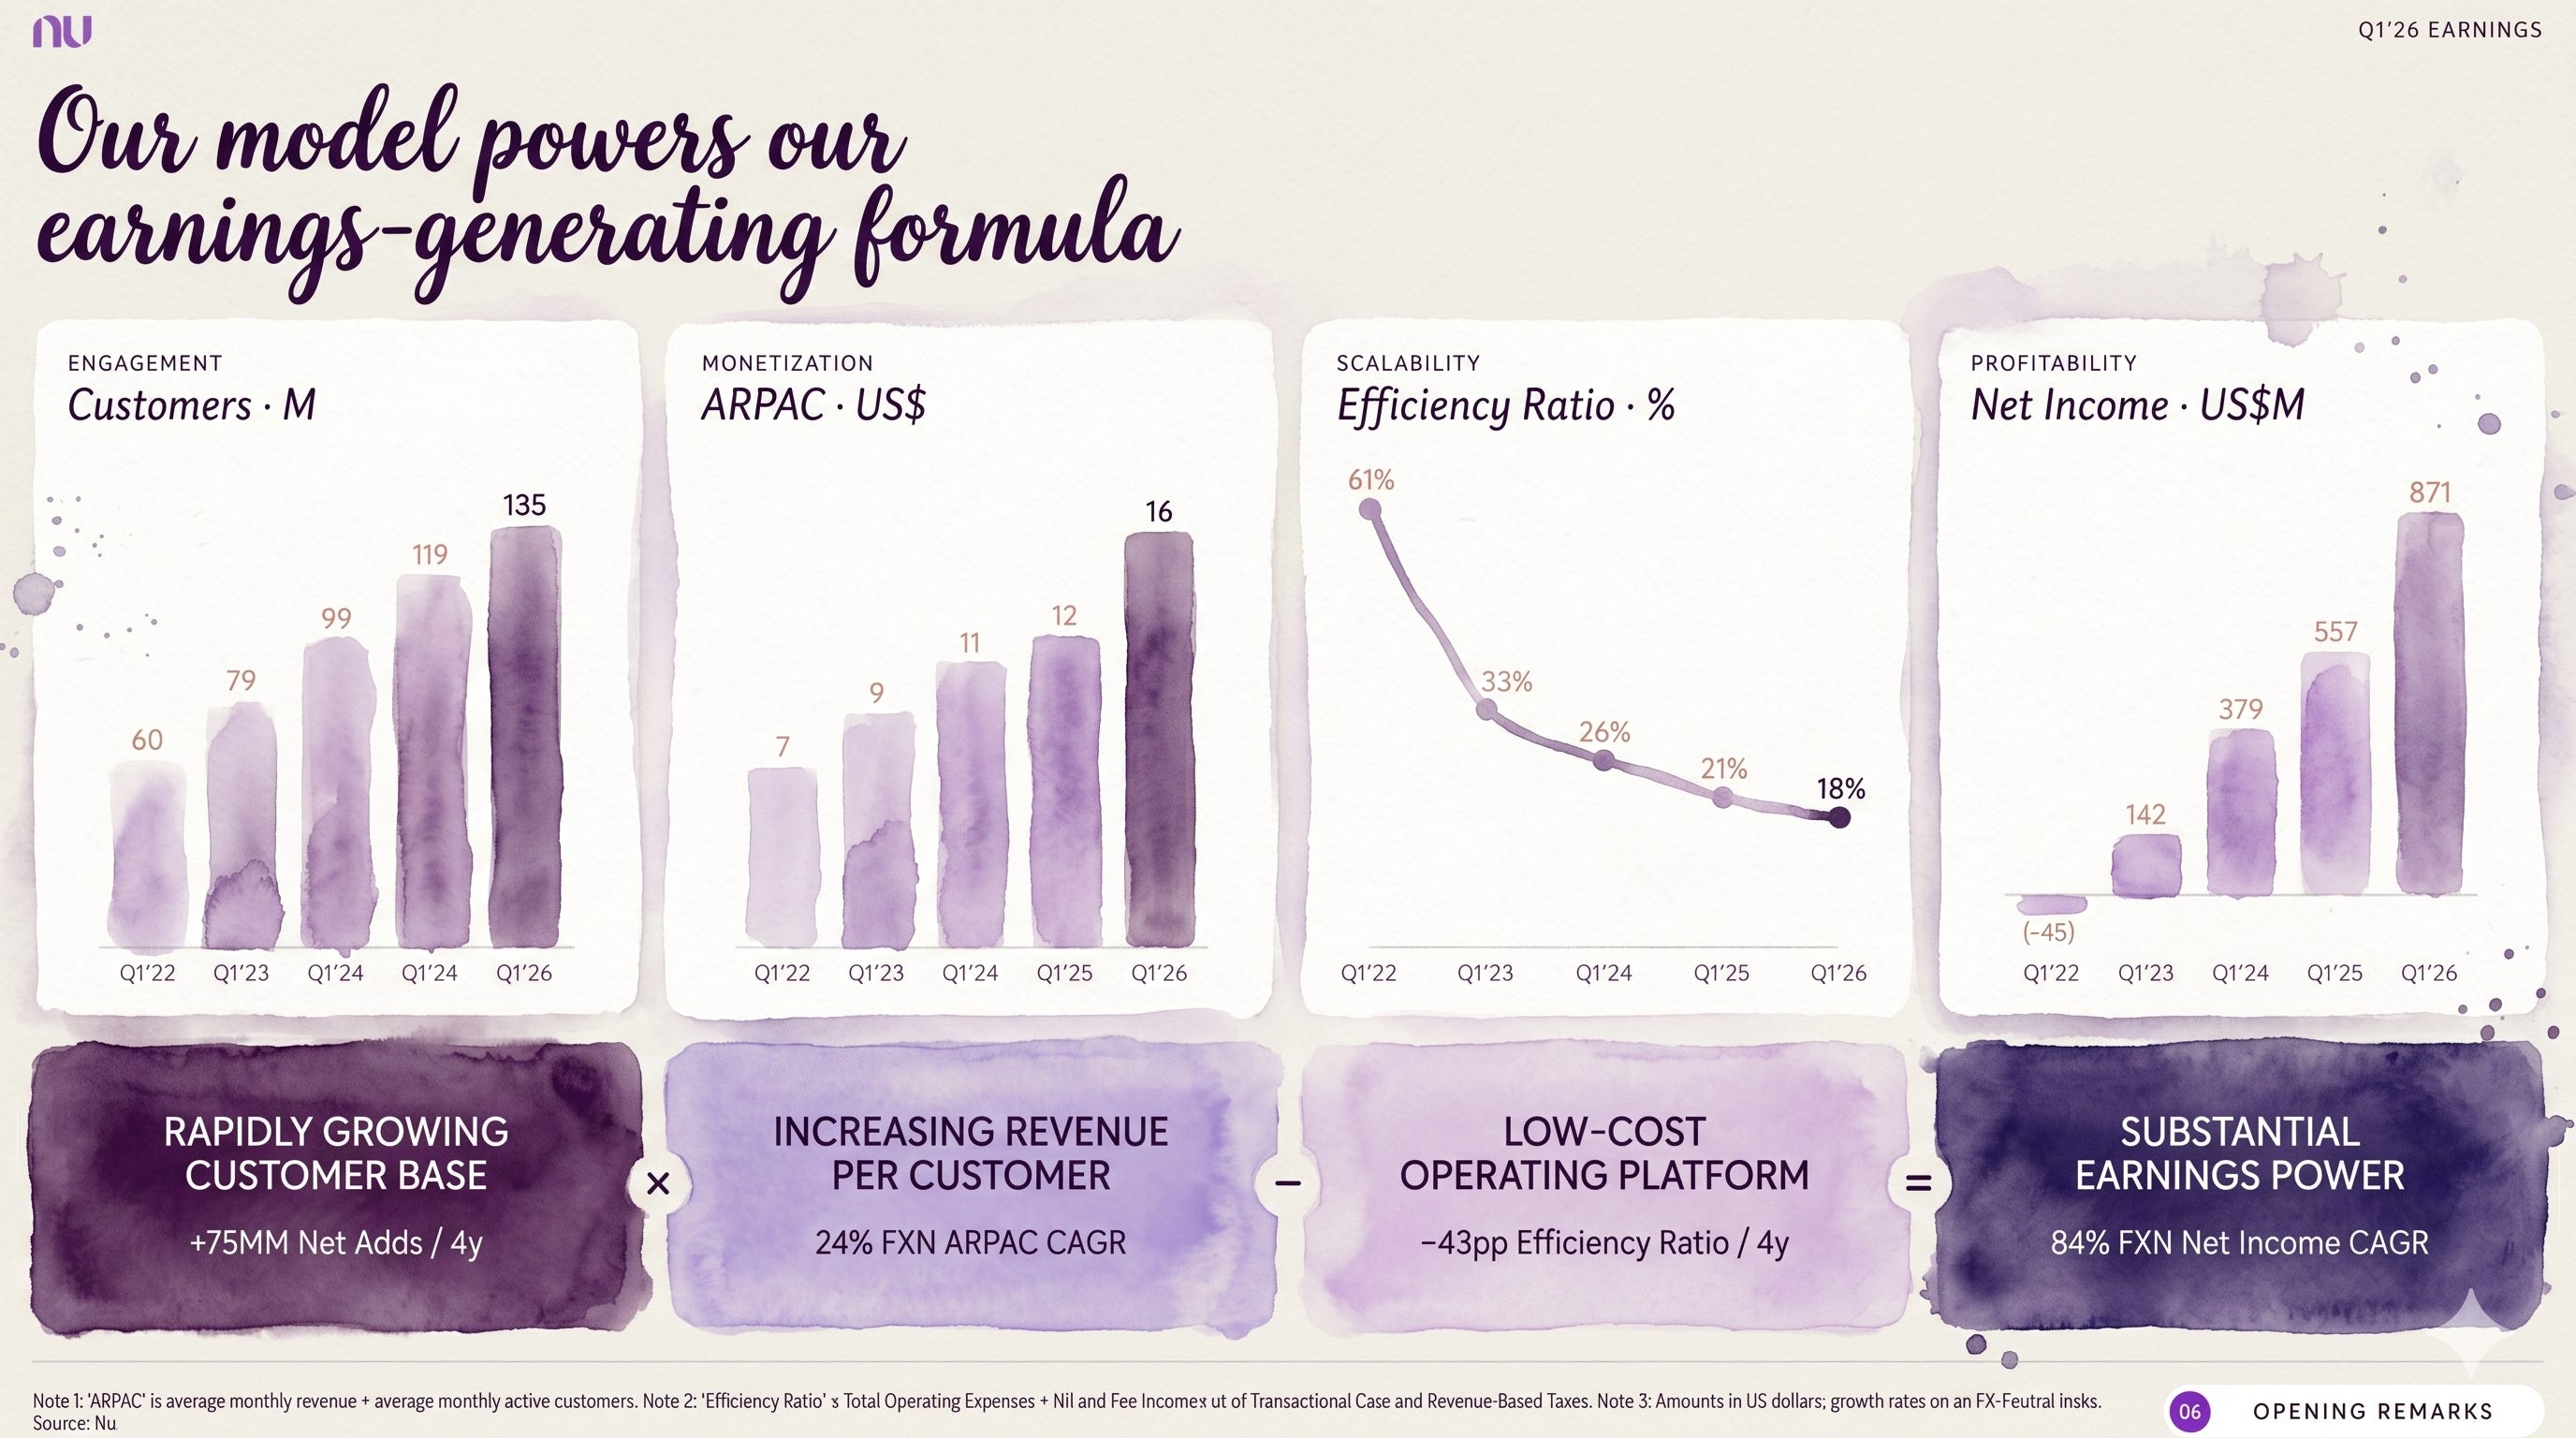
If you look at the Q1’26 investor deck, they plot it out perfectly:
Total customers rising to 135 million
ARPAC climbing to ~$16
Efficiency ratio dropping down to 18%
Net income hitting $871 million
On the surface, the quarter was an absolute powerhouse, delivering $871.4 million in managerial Net Income and a scorching 29% Return on Equity (ROE).
Stop and think: When was the last time you saw a traditional bank pull off a 29% ROE while growing its user base this fast?
But if you’ve owned anything even remotely adjacent to the credit space for more than five minutes, you know how this game works. The ultimate villain in banking isn’t usually “revenue.”
No, the real villain is a lagging indicator that shows up late to the party wearing a trench coat: delinquencies, provisioning, and the brutal timing of cash flows.
This structural reality is exactly why Nu is such a love/hate object in the investing community.
It is a spectacular software platform narrative strapped directly to a traditional lender’s balance sheet. When things go right, that combination creates a legendary compounding engine.
When things hit a bumpy patch, it feels like an anxiety subscription.
The Market, The Bulls, and The Bears
The Market View: “It’s a nice app with great tech. But credit losses are the ultimate tax on this business model. Eventually, that tax bill is going to go way up.”
The Bull View: The earnings-generating formula is completely real, and more importantly, it is proving it can travel. Mexico officially reached break-even in Q1’26, proving that the exact same monetization formula can unfold successfully outside of Brazil.
The Bear View: Fast growth mixed with credit expansion and shifting product mixes is a recipe for disaster. Eventually, a future quarter will hit where the risk-adjusted economics crack, and the stock’s valuation multiple will re-rate violently downward like a boring, traditional bank. Because at the end of the day, that’s what it is.
This deep dive really boils down to one fundamental question: Does Nu pass the classic Nick Sleep “Scale Economies Shared” sniff test?
In other words, is Nu taking the benefits of its massive scale and reinvesting them directly into better products, lower prices, and a superior user experience to drive even more scale?
Or is it simply a very well-run lender that will always be held back by a permanent credit discount?
Atomic Take: The Q1’26 numbers absolutely shout “platform leverage,” but this thesis only compounds over the long haul if the credit metrics stay incredibly boring while the customer acquisition machine stays incredibly loud.
Falsifier: If the efficiency ratio begins to drift meaningfully above the ~20% band that management has targeted for the year, the “structural low-cost platform” claim starts to look very wobbly.
How the Business Actually Makes Money
Let’s start by looking at what Nu chooses to disclose, because that gives us a direct window into how management thinks about value creation.
They recently introduced a new Managerial P&L framework (which is a company-defined, non-IFRS measure).
They did this to better explain how value is generated across a platform that spans multiple countries and dozens of products. It’s worth noting that standard IFRS remains their official statutory basis, and net income, capital, and cash are fully preserved. But this managerial view helps us see the moving parts clearly.
In these Managerial P&L terms, Nu’s revenue is definitely not some mysterious banking blob. It is a highly distinct, three-engine system. Out of $5,315.5 million in total managerial revenue for Q1’26, the breakdown looks like this:
The Three-Engine Revenue Breakdown (Q1’26)
Credit Income: $3,173.3m
Float Income: $1,383.0m
Fee Income: $759.1m
Total Performance: $5,315.5m
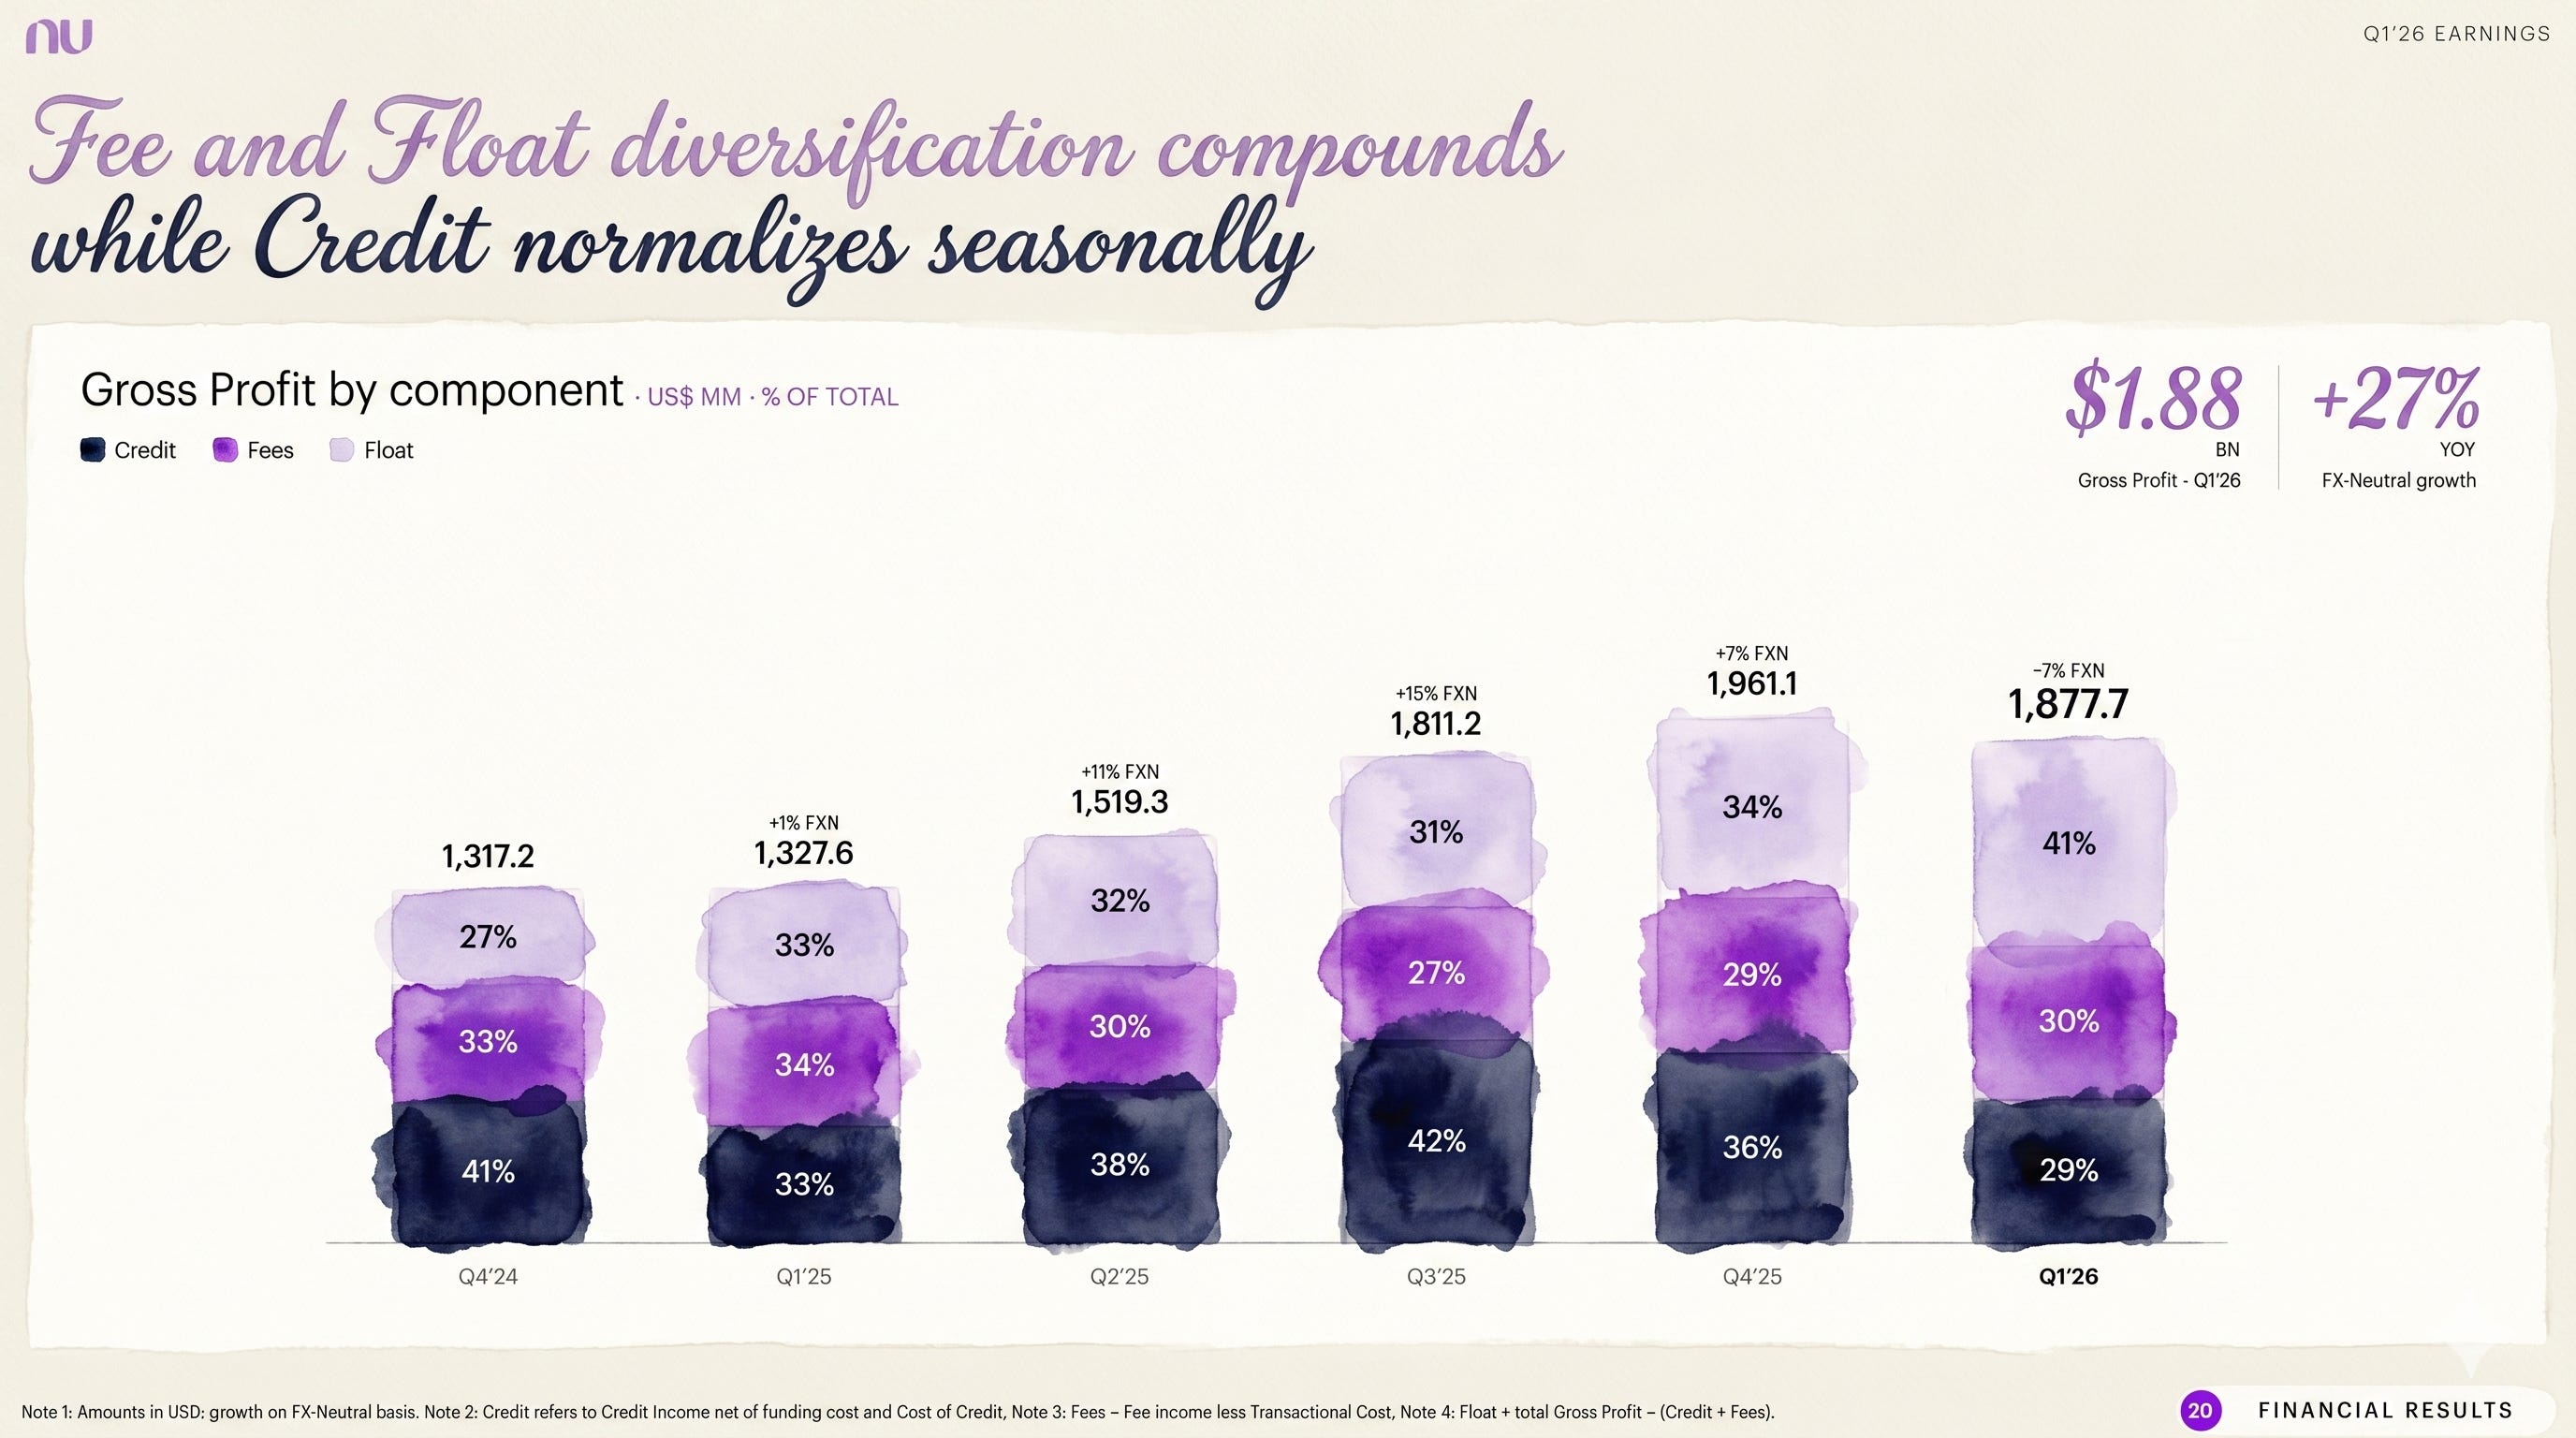
That specific mix matters immensely because it tells you exactly what kind of beast you are underwriting as an investor. If this were a pure credit story, you would be completely hostage to the cost of credit.
But when you have a digital platform that can grow float income and fee income right alongside its credit book, you get a beautiful extra layer of structural resilience. That is, assuming the diversification is real and not just an accounting costume.
Nu’s latest deck explicitly highlights this “fee and float diversification” as a powerful compounding trend, even while noting some typical Q1 seasonality on the credit side. All told, gross profit for the quarter landed at $1,877.7 million.
Now, let’s apply that Nick Sleep/Nomad lens.
“Scale economies shared” means that as the company gets bigger, its cost per unit drops significantly, and the company actively hands a big chunk of those savings back to the customer to lock in their loyalty and keep the loop spinning.
And I think the data points from Nu that track this loop are incredibly compelling:
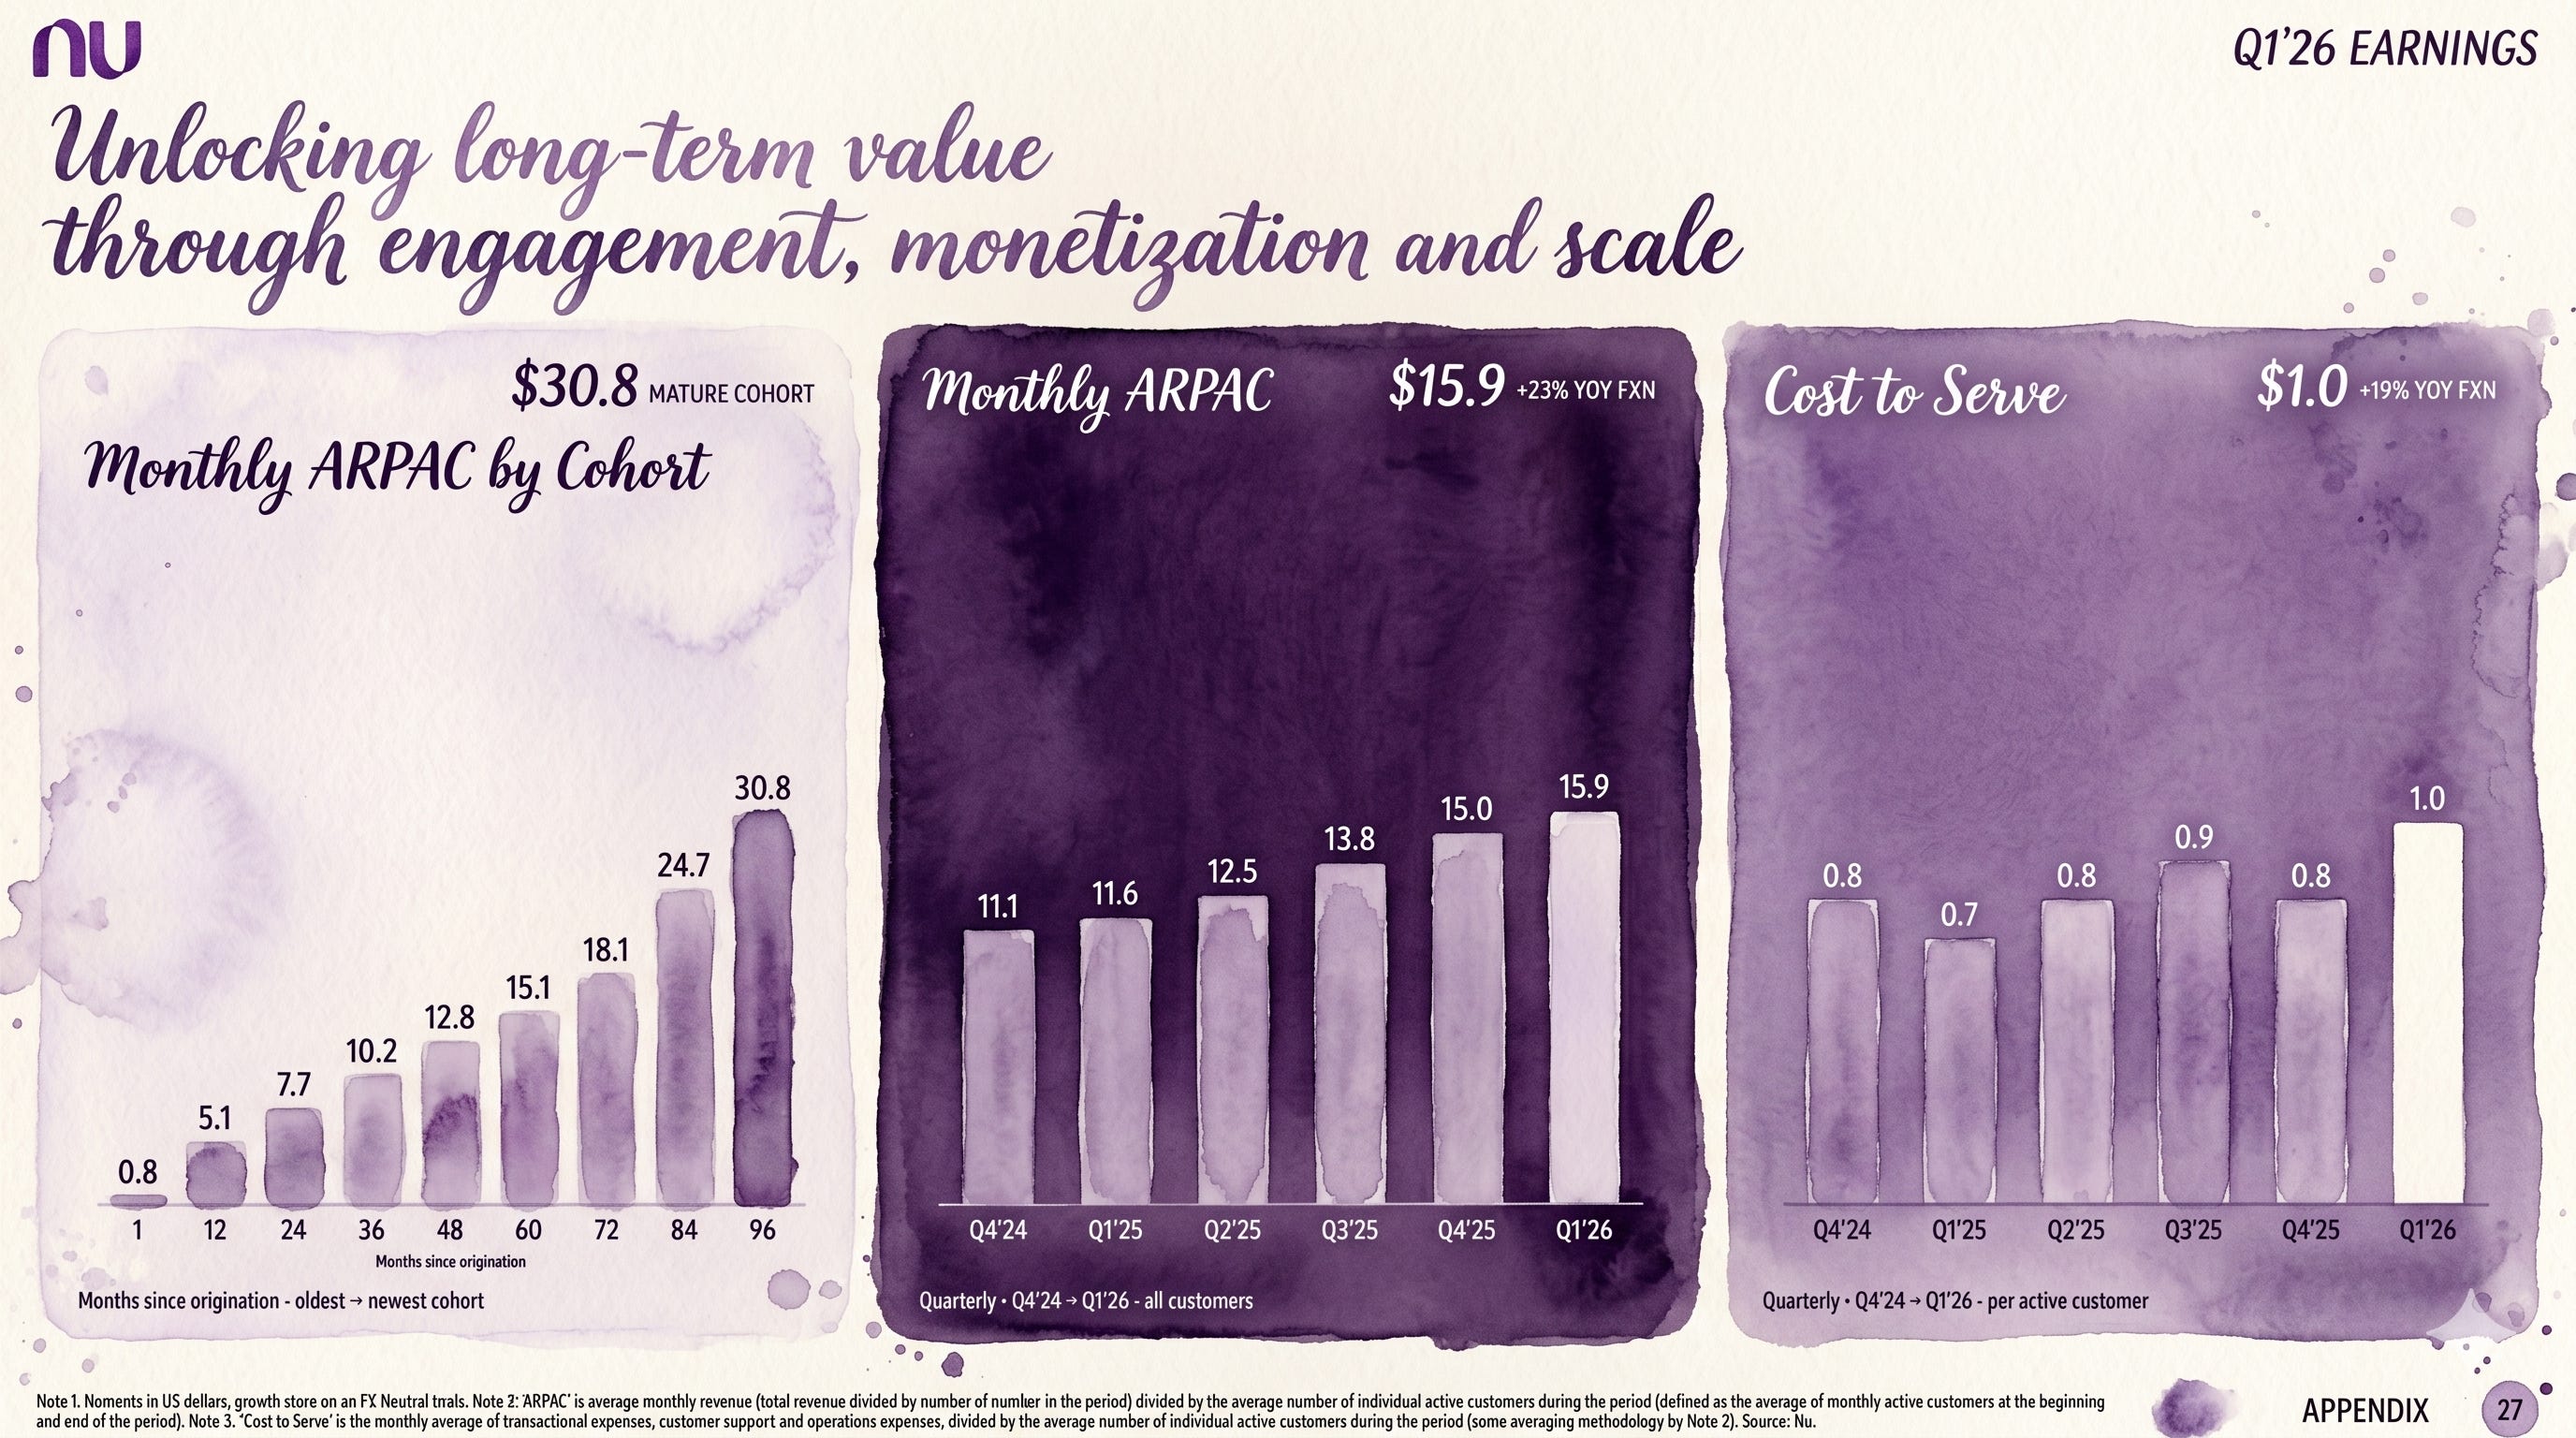
ARPAC reached $15.9, while their historical cohort curves show that their most mature customer cohorts have already reached a hefty $30.8 in monthly ARPAC.
The cost to serve remained rock-solid at just $1.0 per active customer, which stands out as a massive competitive advantage against legacy brick-and-mortar banks.
The efficiency ratio dropped to 18%, with management explicitly boasting on the earnings call about achieving a record-low efficiency ratio below the 18 percent threshold.
Atomic Take: This is about the cleanest setup for “scale economies shared” you will ever see in the financial sector. You have steadily rising customer revenue, an incredibly low and flat cost-to-serve, and an efficiency ratio that looks completely allergic to gravity.
Falsifier: If ARPAC growth suddenly stalls out while the cost to serve begins climbing north of that $1.0 mark, the compounding flywheel will start looking like a basic treadmill.
What Went Wrong
Nothing actually “went wrong” this quarter in the catastrophic sense of the phrase. Instead, the anxiety here is entirely structural.
Any business model that is driven by high-growth credit gets judged on two completely different timelines simultaneously:
The Fast Timeline: This is the exciting stuff: customer growth, climbing ARPAC, and improving efficiency ratios.
The Slow Timeline: This is the quiet, lagging stuff: creeping delinquencies and the heavy burden of provisioning for bad loans.
During Q1’26, the portfolio behaved exactly the way credit portfolios typically behave during the first quarter of the year: early-stage delinquencies ticked upward, while late-stage delinquencies managed not to implode.
Looking directly at the headline metrics from the earnings release, the shift becomes clear:
NPL 15–90 hit 5.0%, marking a noticeable step up from the 4.1% we saw in Q4’25.
NPL 90+ landed at 6.5%, which was actually down a tiny bit on a sequential basis.
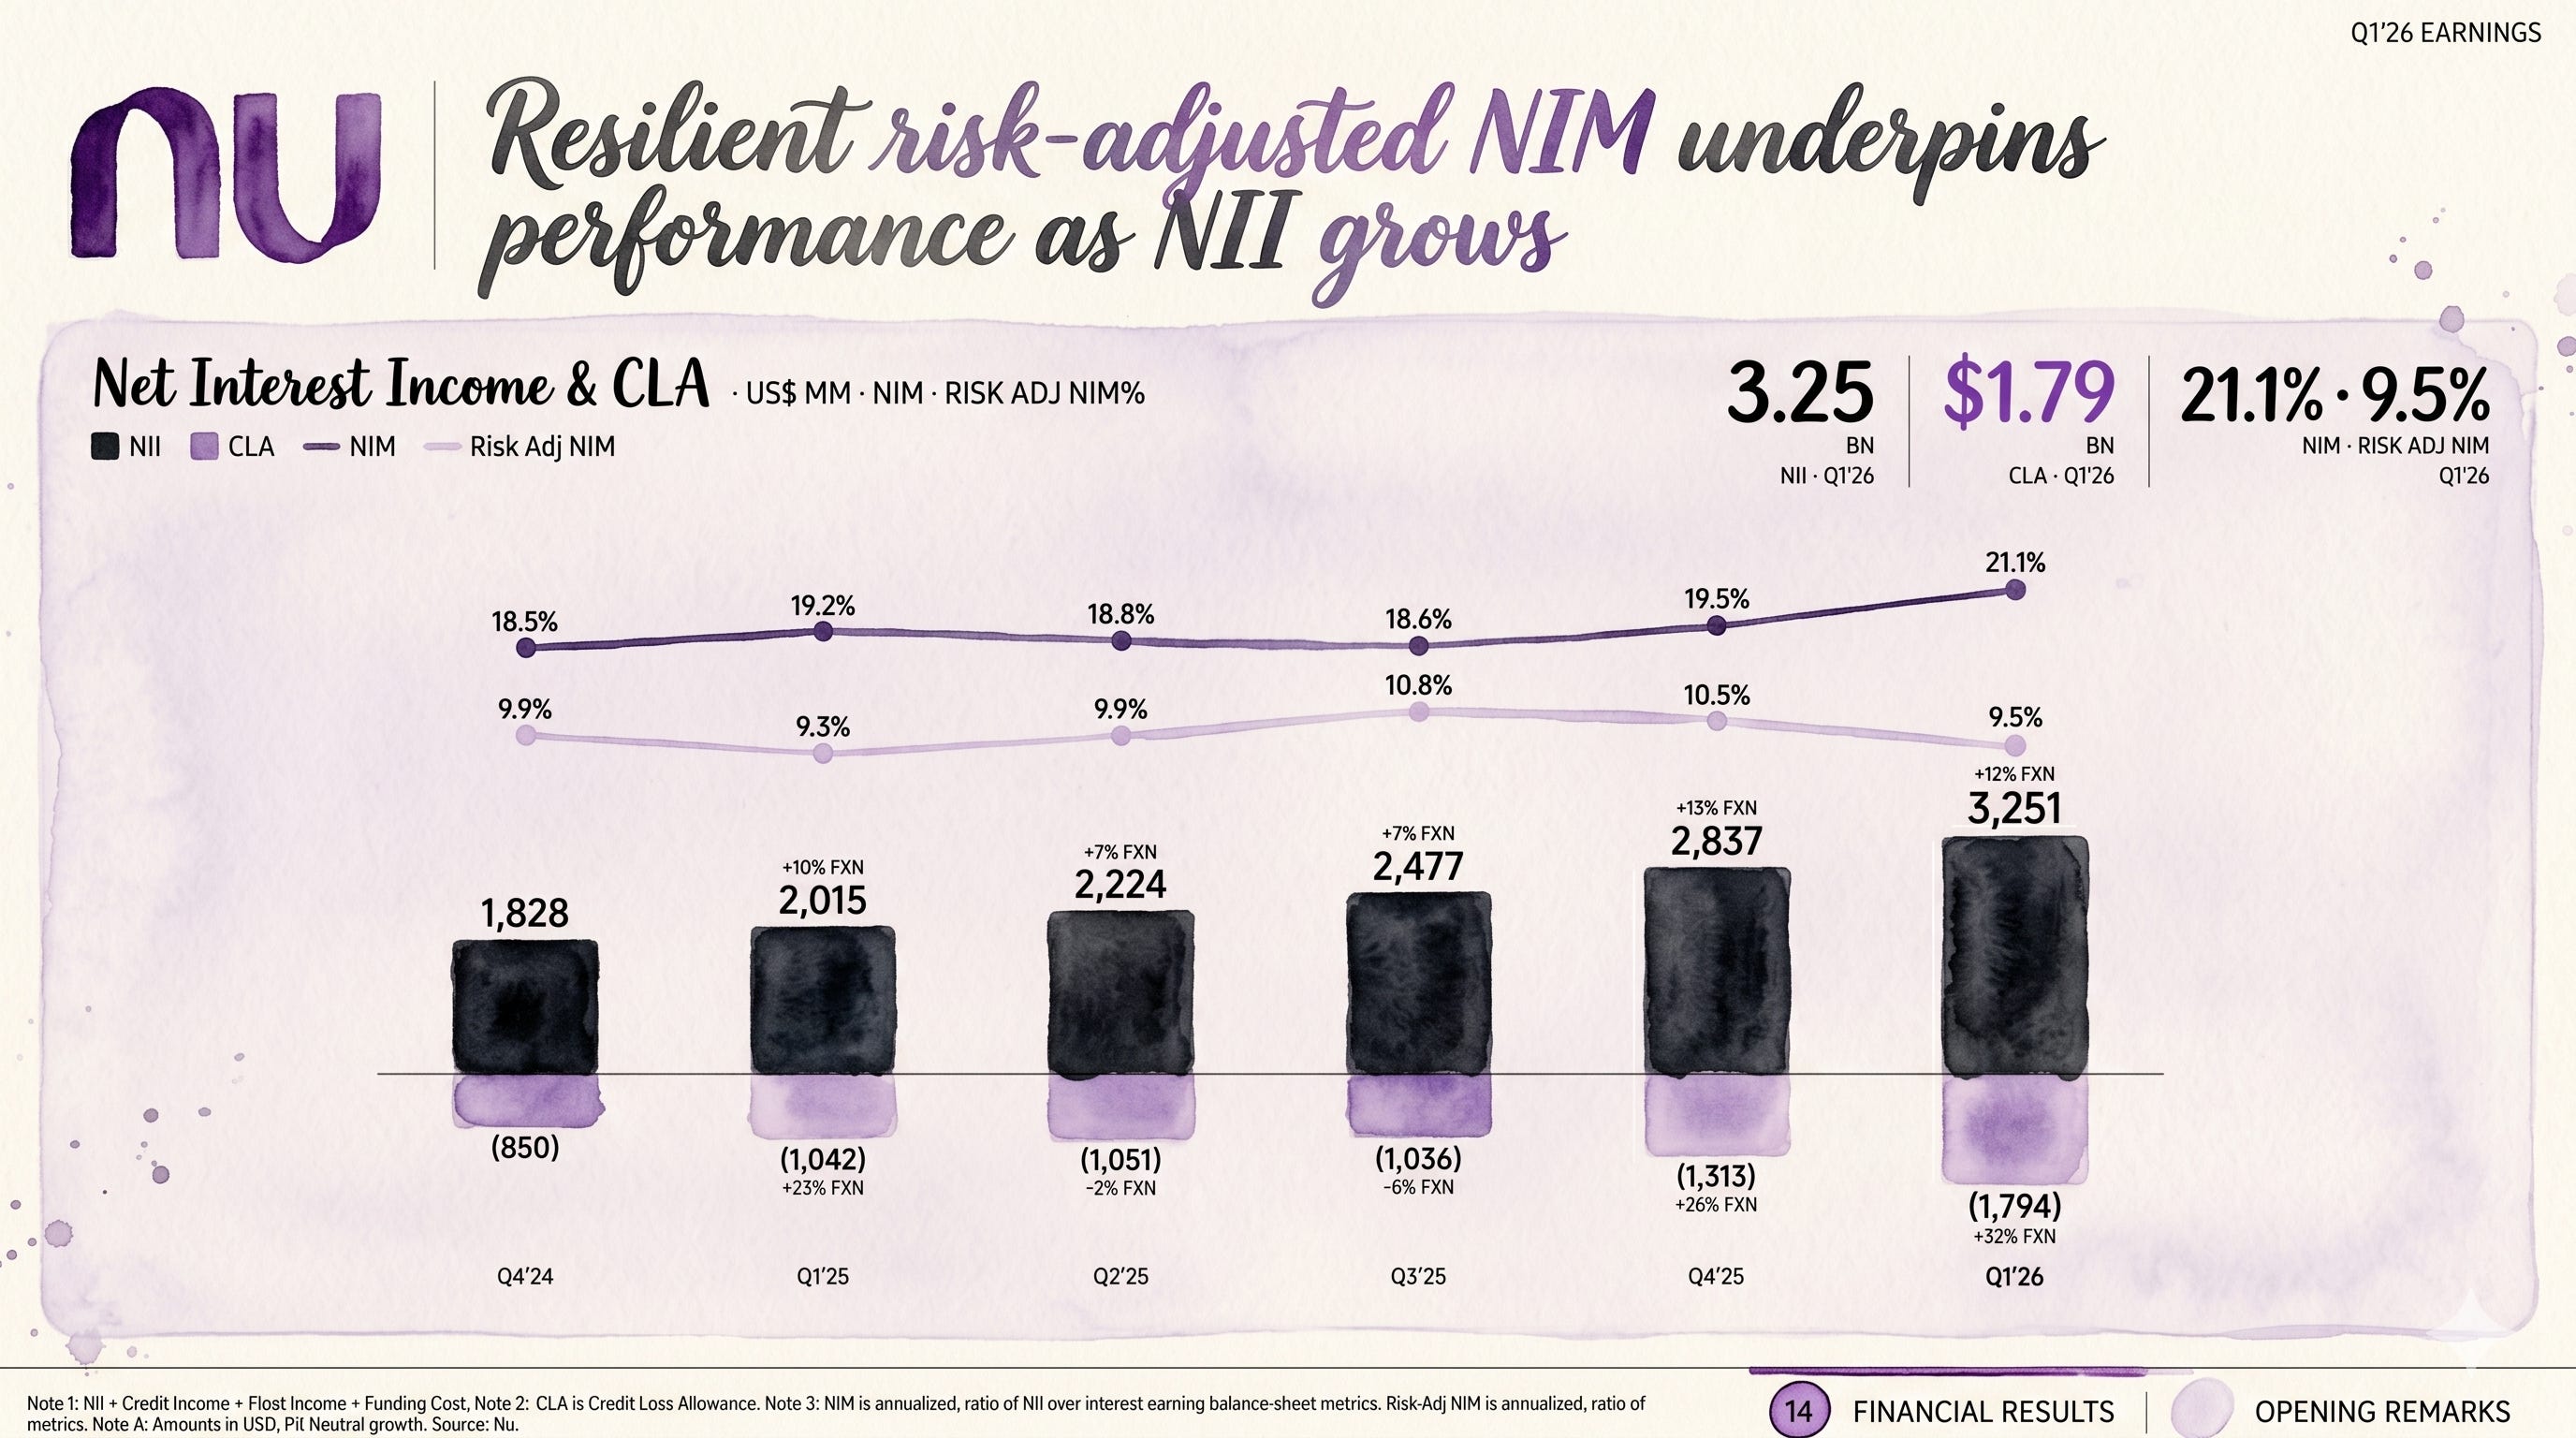
Because of this mix shift and credit expansion, the company’s risk-adjusted economics took a step backward. The Risk-Adjusted Net Interest Margin (NIM) landed at 9.5%, down from the 10.5% recorded in the previous quarter.
Management’s core defense across their call and investor materials can be summarized simply: regular seasonal trends, combined with aggressive growth and product mix changes, naturally required them to book higher provisions. They explicitly stated that they do not view this asset behavior as a structural degradation of the portfolio.
Stop and think: This is exactly where casual investors get completely wrecked by corporate vocabulary.
Saying “asset quality isn’t degrading” can be factually accurate in a narrow sense because late-stage NPLs remained stable.
At the exact same time, saying “risk-adjusted profitability got worse this quarter” is also 100% true because the risk-adjusted NIM compressed by a full percentage point.
Those two realities do not contradict each other.
Instead, they serve as a loud, clear warning label that your true margin of safety in an investment like Nu is strict, unyielding credit discipline.
Atomic Take: Q1 didn’t break the fundamental investment thesis for Nu by any means. What it did was give everyone a sharp reminder that this high-flying platform flywheel is still firmly attached to a credit engine that suffers real, seasonal bruises.
Falsifier: If the NPL 90+ metric begins climbing meaningfully past 6.5% while the risk-adjusted NIM continues to compress below 9.5%, then blaming “seasonality” will officially turn into corporate denial, in my view.
Rebound Catalysts
When you are looking for things to go right with a business, you need testable milestones.
Let’s look at the actual gauges on the dashboard that will tell us if this machine is accelerating safely.
#1. Mexico Becomes a Repeatable Profit Machine
Nu tells us that Mexico officially crossed 15 million customers and reached break-even in Q1’26, proving that their signature “earnings-generating formula” can work outside of Brazil.
But here is the common-sense test: hitting zero once for a single quarter doesn’t prove a trend. The real test is whether Mexico can transform from an exciting “inflection point” into a massive, steady profit contributor to the group, all without dragging down that beautiful consolidated efficiency ratio.
#2. Artificial Intelligence Shows Up in Credit Outcomes, Not Just Productivity Anecdotes
Nu loves to talk about its multi-phase AI transformation, and to be fair, they have some fantastic productivity metrics to show for it. They claim engineering throughput is up 50% YoY and testing cycles are running 90% faster.
They also state that their AI Private Banker now serves over 15 million monthly active users, and their proprietary “NuFormer” model is fully live in production, making credit card decisions in Brazil and Mexico, as well as handling unsecured lending in Brazil.
Stop and think: Every CEO on earth is talking about AI right now. But in banking, true AI shouldn’t just mean faster coding. It has to mean smarter lending.
If their AI is truly a competitive advantage in underwriting, it shouldn’t just stay a nice tech story. It has to show up in the numbers where it matters: credit limits growing safely with extreme resilience.
I want to see their risk-adjusted economics stabilize and hold firm even as the total loan book expands.
#3. ARPAC Keeps Climbing as Cohorts Mature
When you look at Nu’s customer cohort charts, management is essentially telling you: “Be patient, because patience gets paid.” While their headline ARPAC sits at $15.9 for Q1’26, their oldest, most mature customer cohorts have already climbed to a massive $30.8 in monthly ARPAC.
As long as new customers follow that exact same upward trajectory over time, the top-line engine takes care of itself.
#4. Efficiency Stays Within Guardrails While Launching New Bets
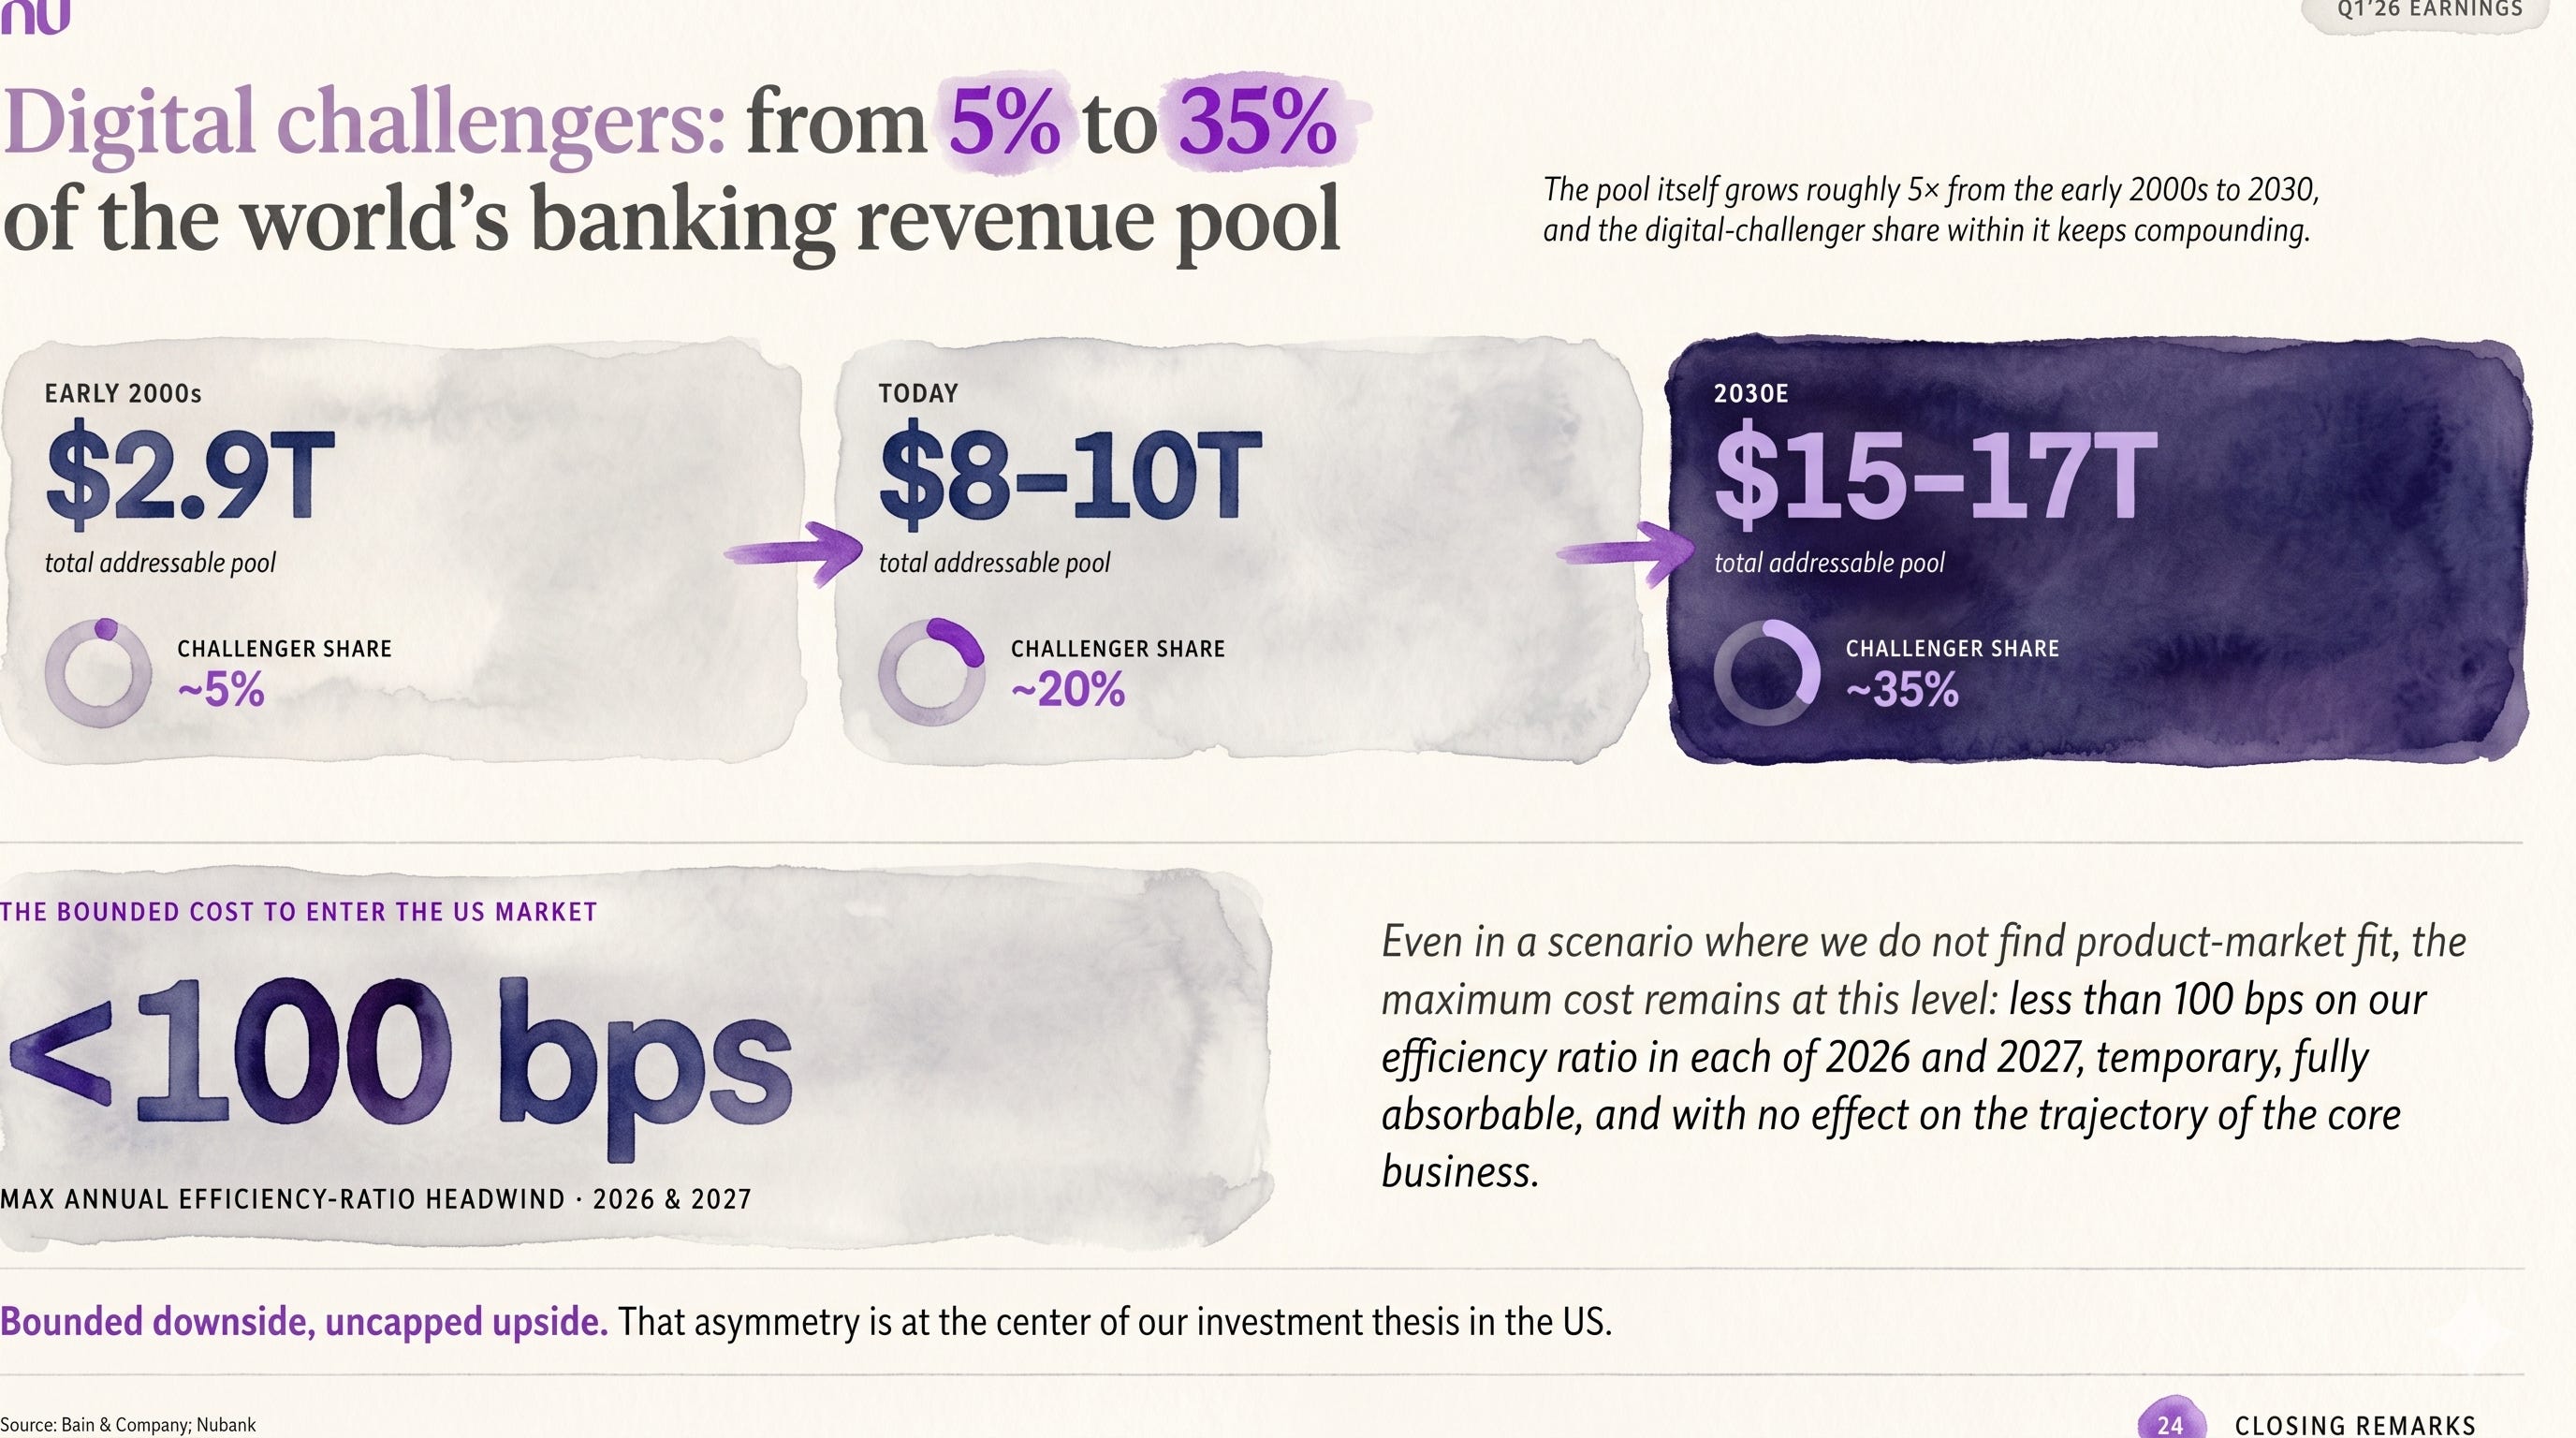
Nu is currently laying the groundwork for a U.S. expansion, but they are framing it as a highly disciplined, strictly capped experiment. They expect the maximum investment impact to remain below 100 bps on the consolidated efficiency ratio across both 2026 and 2027.
Management explicitly notes that this investment will be contained within the general ~20% efficiency range they have communicated for the full year.
The investor deck even uses the phrase “bounded cost to enter,” meaning they have intentionally built a roof over their potential downside.
Atomic Take: The perfect script for Nu from here is beautifully simple: we want the business to be incredibly boring in the places that cause sleepless nights (NPLs and efficiency) and incredibly loud in the places that create massive wealth (ARPAC growth and Mexican profitability).
Falsifier: If the consolidated efficiency ratio begins to meaningfully degrade despite this “<100 bps” U.S. spending cap, the narrative that they can fund major new expansions without breaking the core margin machine will face—and fail—its very first live test.
Financial Quality Rubric (Score: 1 to 5)
Let’s look at this business through a classic, no-nonsense financial checklist to see exactly what we are buying.