

Deep Dive: Sea Ltd ($SE)
Sea is a compounding system disguised as three separate businesses—and the market is still trying to figure out which one is the real story.

New to The Atomic Moat? This analysis of Sea Ltd ($SE) is a prime example of how we dissect high-quality compounders. If you want these deep dives sent to your inbox, join 900+ other investors below.
For a long time, Sea was the poster child for “Profitless Tech.” It was the stock you owned in 2021 because your neighbor did, and the stock you sold in 2022 because you were tired of hearing about “adjusted” metrics while the cash burned.
But a funny thing happened while we were looking away.
The “mess” turned into a machine.
If You’re In a Rush
What they do: Sea Limited is three companies wearing one trench coat. You’ve got Shopee (the shopping mall), Monee (the bank), and Garena (the arcade).
The Headache: Wall Street hates complexity. This stock is three different underwriting problems wrapped in one ticker: retail wars (Shopee), credit risk (Monee), and the rollercoaster of gaming cycles (Garena). Plus, the accounting optics make people argue over what’s actually “real” profit.
The Fix: The numbers are finally shutting up the critics. Shopee is cranking up monetization without scaring away shoppers. The bank (DFS) is growing its loan book while keeping the credit quality boring (boring is good in banking). And Garena? It’s surging again, proving it’s not just a “one-hit wonder.”
Atomic Position: High Conviction (with caveats). I like it, but we have to watch the credit quality like a hawk. If the bank starts making bad loans, the whole story changes.
While the market was busy arguing about interest rates, Sea quietly tightened the screws. They stopped lighting money on fire to chase growth and started demanding that the business actually work. And in Q3 2025, the scoreboard lit up in a way that is impossible to ignore.
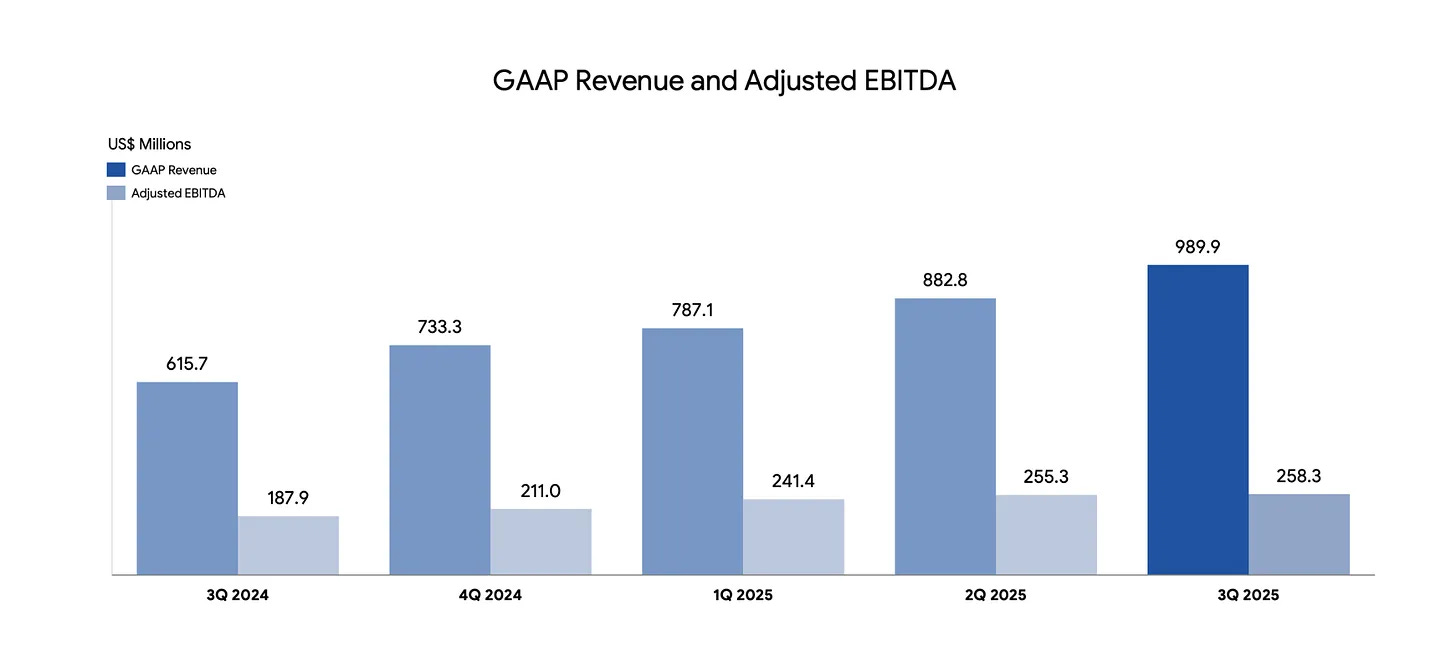
This isn’t a “hope” trade anymore. This is a company that just posted nearly $6 billion in revenue and almost $900 million in EBITDA in a single quarter.
Why are we digging in now?
Because the market is still treating this like a disjointed collection of businesses—a retailer, a bank, and a game studio glued together by duct tape. They charge it a “complexity tax.”
But what if the complexity isn’t a bug? What if it’s the moat?
We are going to take this thing apart, piece by piece. We’re going to look at the Shopee demand engine, the DFS credit book (the scary part), and the Garena cash cannon. We aren’t going to rely on Wall Street jargon or “adjusted” fluff. We are going to look at the cash, the loans, and the users.
Put the coffee on. It’s time to move Sea out of the “Too Hard” pile and onto the operating table.
What they do:
Sea Limited is basically three companies wearing one trench coat. You’ve got Shopee (the shopping mall), Monee (the bank), and Garena (the arcade).
The Headache: Wall Street hates complexity. This stock is three different underwriting problems wrapped in one ticker: retail competition (Shopee), credit risk (Monee), and the rollercoaster of gaming cycles (Garena). Plus, the accounting optics make people argue over what’s actually “real” profit.
The Fix: The numbers are starting to shut up the critics. Shopee is cranking up monetization without scaring away shoppers. The bank (DFS) is growing its loan book while keeping the credit quality boring (boring is good in banking). And Garena? It’s surging again, proving it’s not just a “one-hit wonder.”
Atomic Position: High Conviction (with caveats). I like it, but we have to watch the credit quality like a hawk. If the bank starts making bad loans, the whole story changes.
The Setup: No More Hand-Waving
For a long time, the debate on Sea Limited was based on vibes and promises. That era is over. Sea’s Q3 2025 print is the kind of report that forces the market to put down the coffee and look at the scoreboard.
The machine is printing money. Real money. At scale.
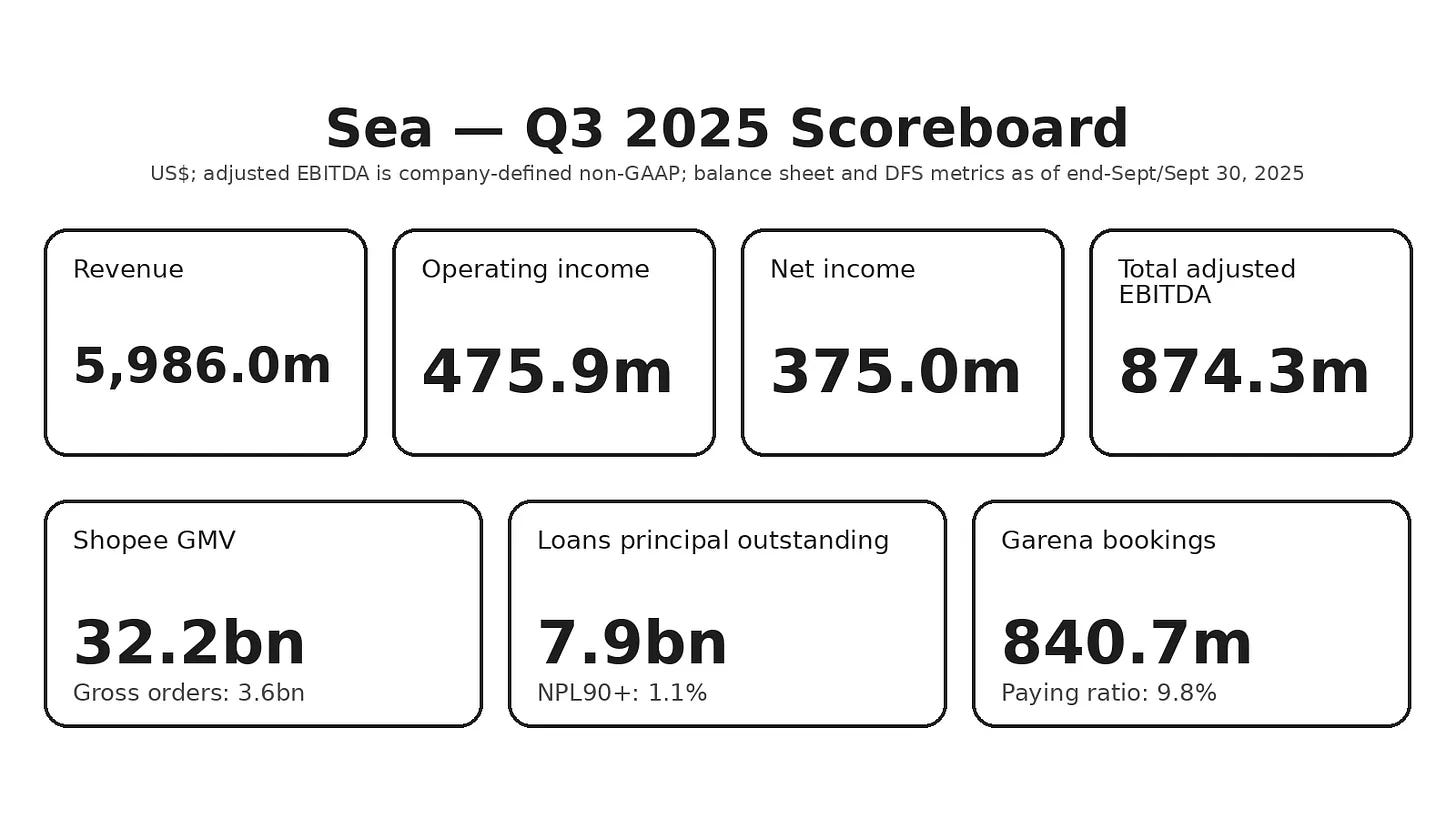
The Scoreboard:
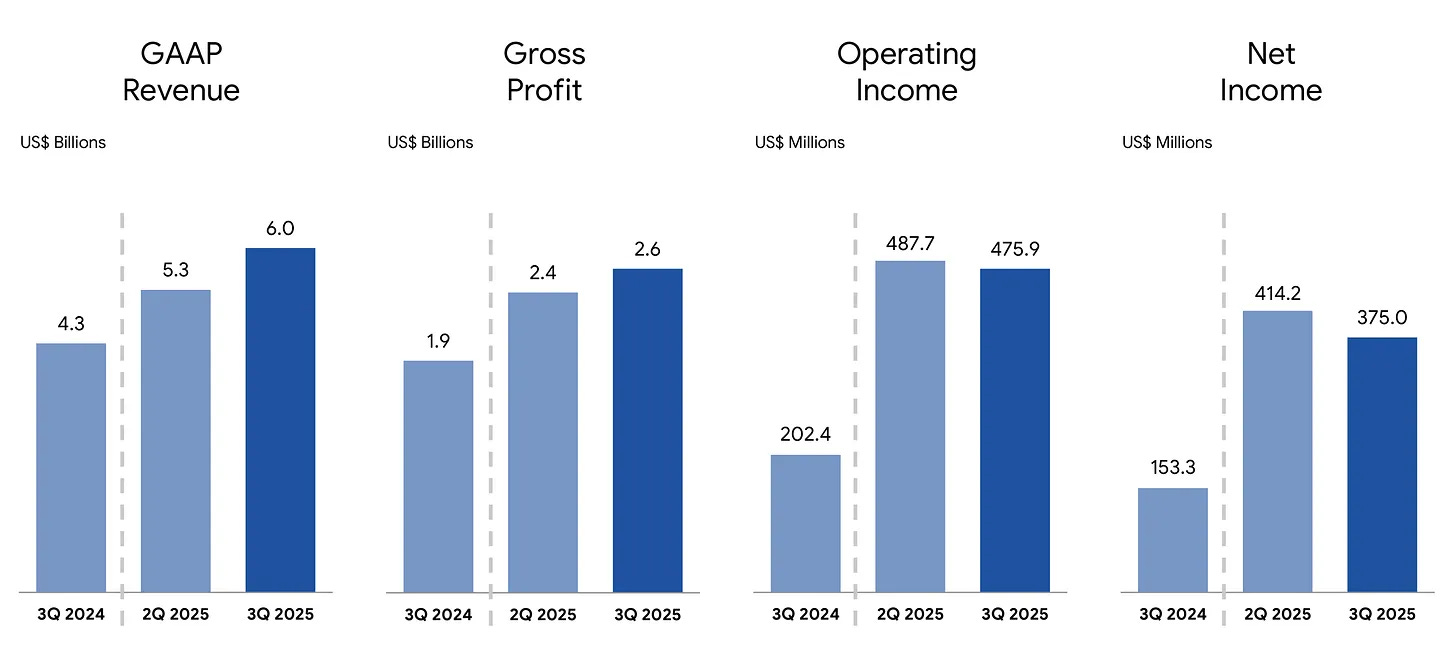
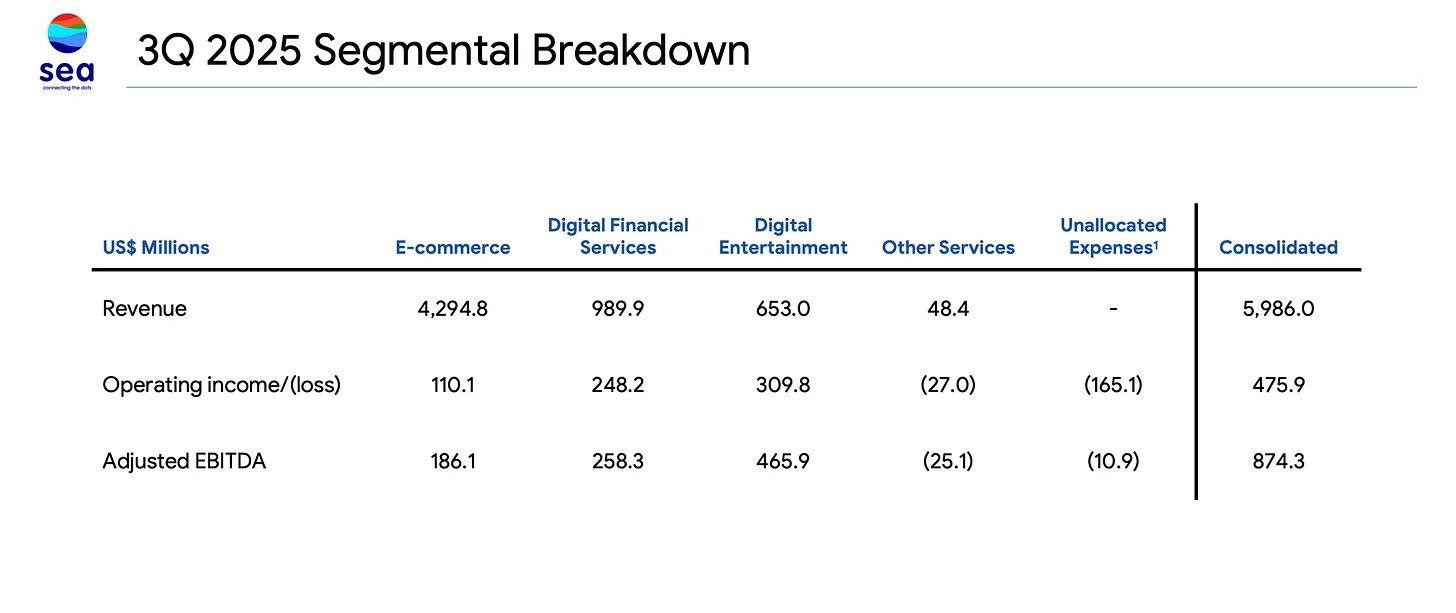
Revenue: $5,986.0m
Operating Income: $475.9m
Net Income: $375.0m
Total Adjusted EBITDA: $874.3m
Stop & Think: Just a few years ago, people were asking if this business model could ever turn a profit. Now they just posted nearly $900 million in adjusted EBITDA in ninety days. The conversation has shifted.
These four numbers matter because they change the debate. We aren’t asking “Can this work?” anymore. We are asking “What exactly are we buying here?”
Three Engines, One Quarter
Here is the variant perception—the difference between what the Street sees and what I see.
The Market View: Sea is a “conglomerate discount” waiting to happen. It’s hard to value because the risk profile shifts every quarter. Is it a tech platform? A lender? A gaming studio? It gives analysts a headache.
The Bull View (My view at the time of writing): The bundle isn’t the problem; the bundle is the moat. Shopee brings the people in. Monee (DFS) lends to them. Garena prints the cash to fund the growth. It’s a self-feeding machine.
The Bear View: The bundle is a trap. Bears say the shipping subsidies never really go away (a permanent tax), Garena is just a cyclical boom-bust business, and eventually, the “Digital Financial Services” (DFS) arm gets so big that the stock trades like a risky bank book rather than a tech stock.
The “Why Now”: I’m looking at three dials on the dashboard, and for the first time in a while, they all turned green at the exact same moment.
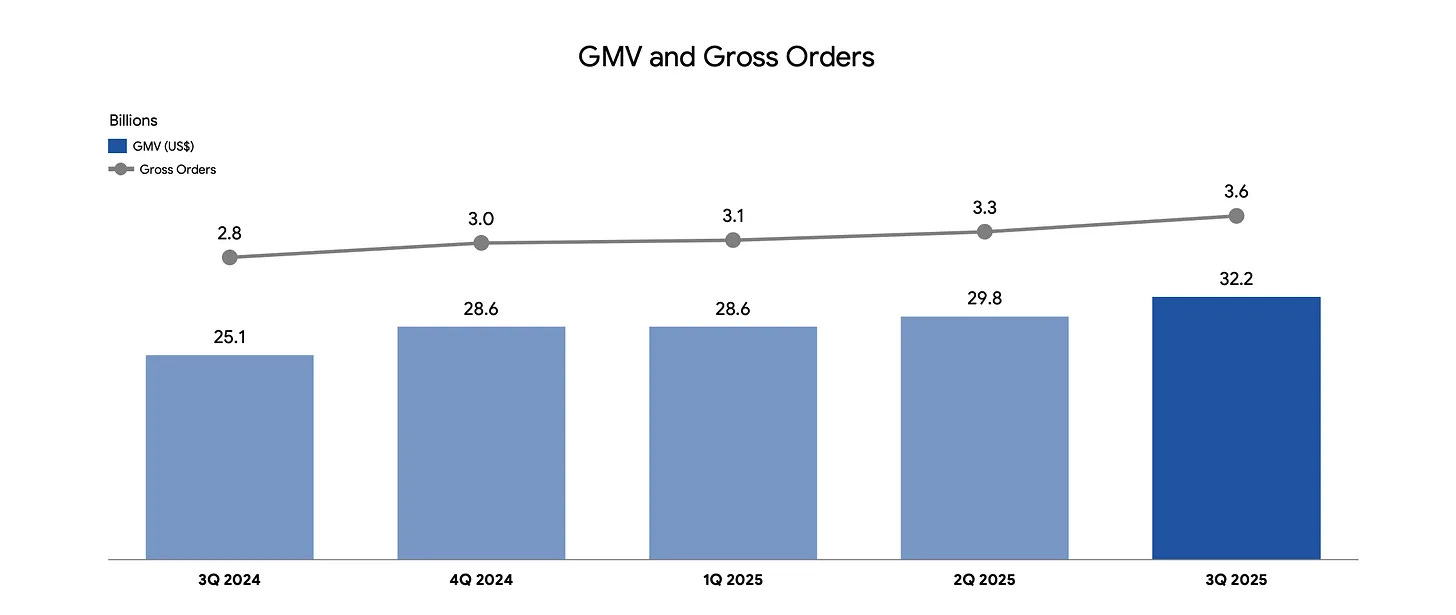
Dial 1: The Mall (Commerce) The mall is getting bigger. Shopee GMV hit $32.2bn and gross orders clocked in at 3.6bn. The demand engine isn’t slowing down; it’s accelerating.
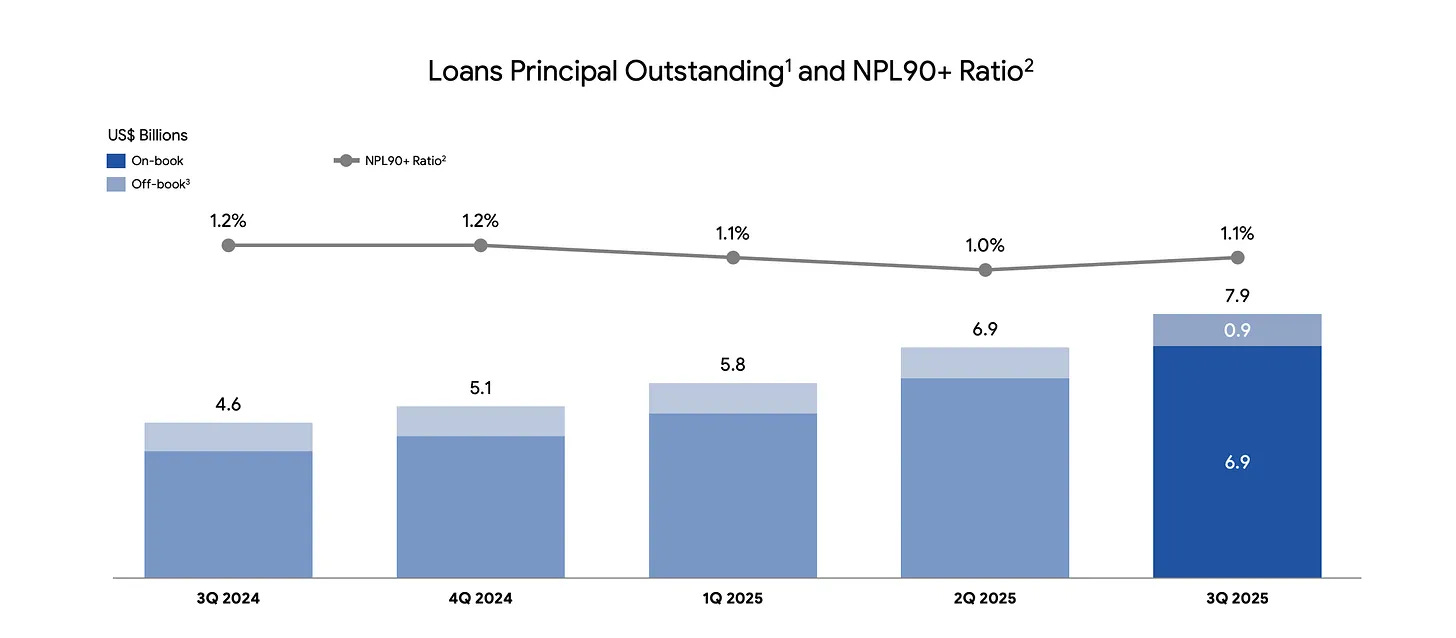
Dial 2: The Bank (DFS) The loan book is scaling up. Consumer + SME loans principal outstanding reached $7.9bn (at end-Sept). And here is the “Geiger counter” for risk: NPL90+ (non-performing loans over 90 days) was disclosed at 1.1%. As long as that number stays low, we’re in business.
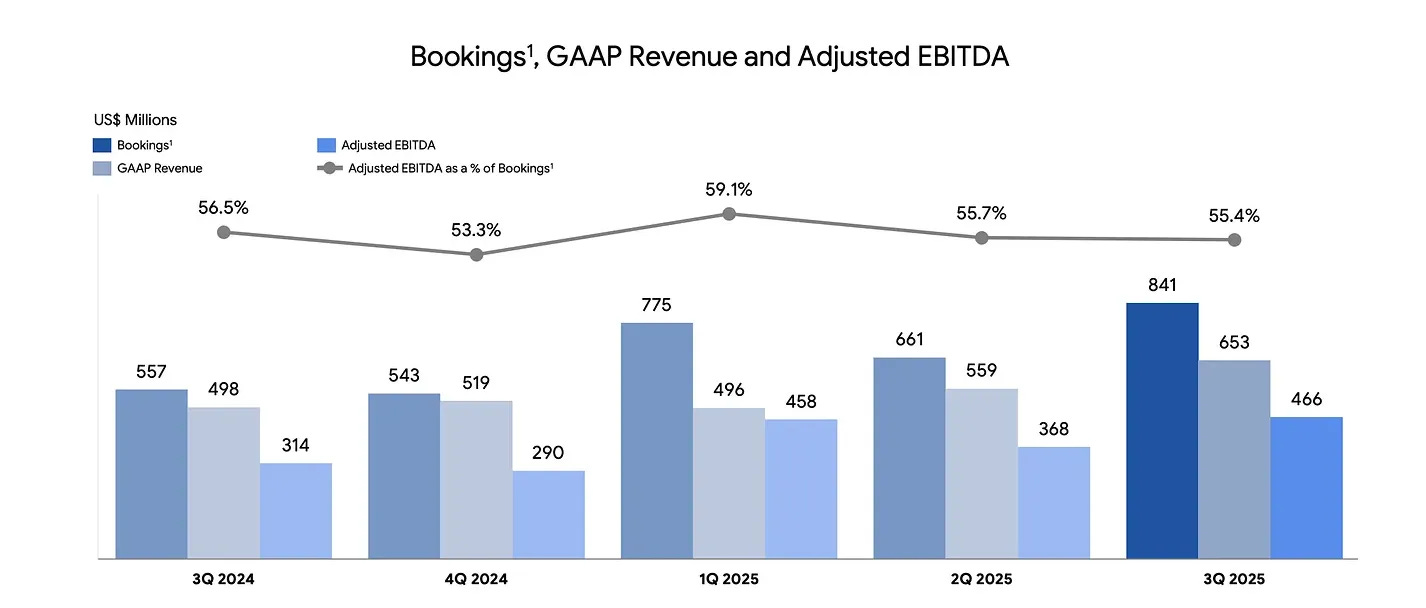
Dial 3: The Arcade (Garena) When this hits, it hits hard. Bookings came in at $840.7m. This is your margin cannon. It prints cash that hides a lot of sins elsewhere.
The Duration Question
This is starting to look like a Nick Sleep / Nomad-style case study in “duration.” Duration isn’t just a fancy finance word; it’s a practical question: How long can this system keep compounding before one part breaks?
If this were just one business, it would be easy. But Sea asks you to bet on a system. Systems can grow brutally fast, but they can also fail in weird, non-linear ways. That’s why the market charges them a “complexity tax.”
FACT: Segment revenue was $4,294.8m (e-commerce), $989.9m (DFS), and $653.0m (digital entertainment).
HYPOTHESIS: If Shopee can charge more (monetization) while the DFS credit book stays boring, that “complexity tax” disappears and the stock re-rates higher.
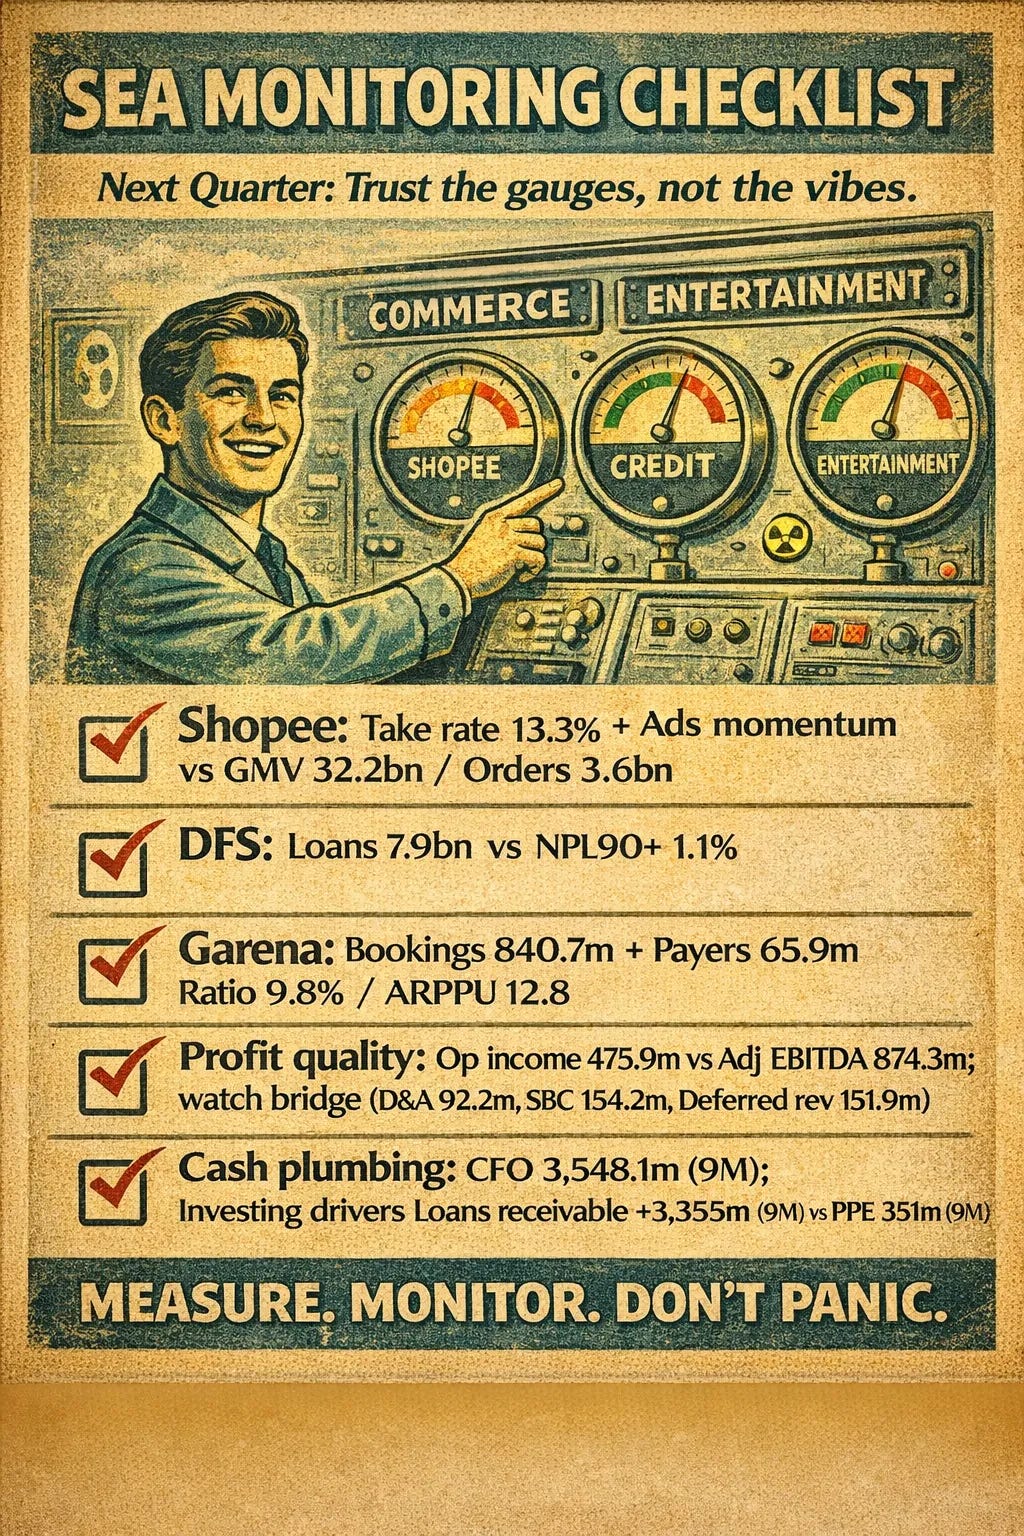
MONITOR: Shopee take rate; DFS NPL90+; Garena bookings.
How the Business Actually Makes Money
Forget the segments for a second. Let’s pop the hood. You understand this company by looking at the “knobs” management can turn.
Shopee’s knobs: Volume, conversion, and ads (this is the big one).
DFS’s knobs: Who do we lend to? How much cash do we have?
Garena’s knobs: Are people playing? Are they paying?
1. Shopee: The Optics vs. The Reality
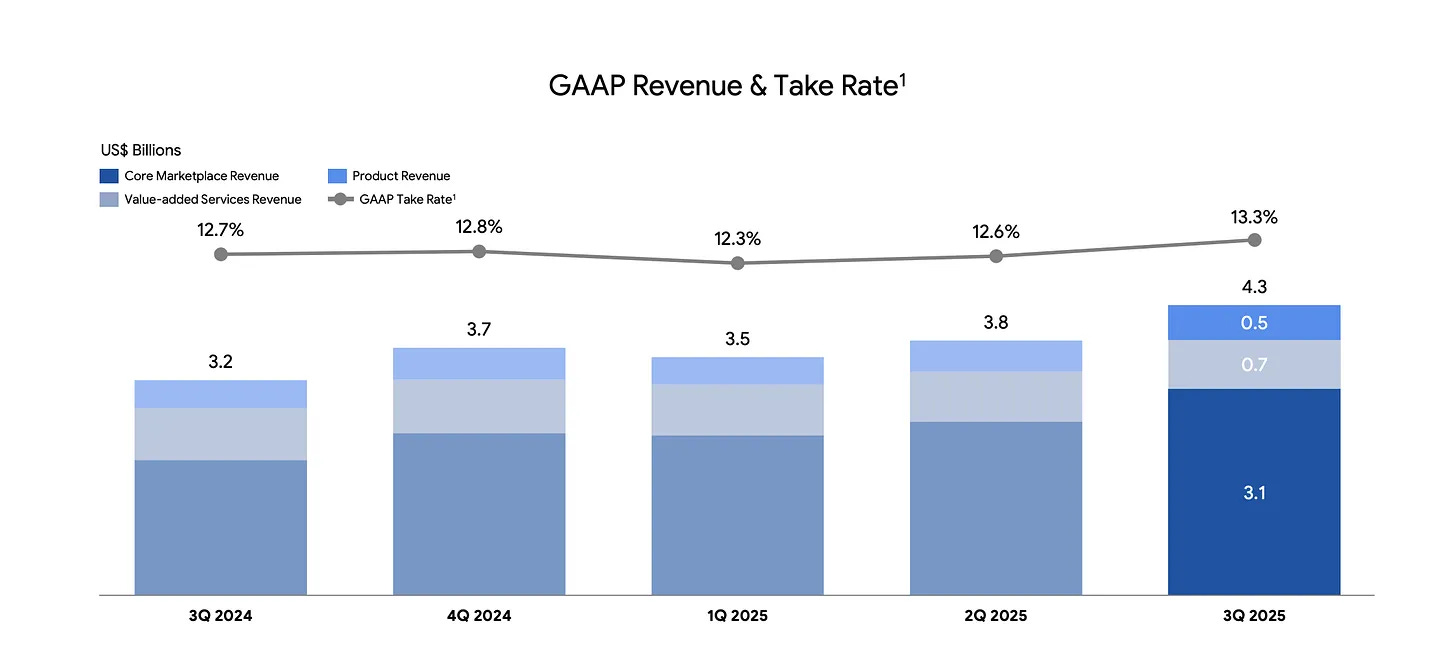
Management breaks e-commerce revenue into marketplace revenue ($3.8bn)—which is split into core marketplace ($3.1bn) and value-added services ($0.7bn).
Now, catch this detail: They explicitly said value-added services (mostly logistics) declined year-on-year. Why? Because of increased shipping subsidies.
Here is the plain English translation: They are eating the shipping cost to keep you happy. They are taking a bruise on the “optics” to keep the competitive edge sharp.
Is it worth it? The answer lies in monetization, specifically ads.
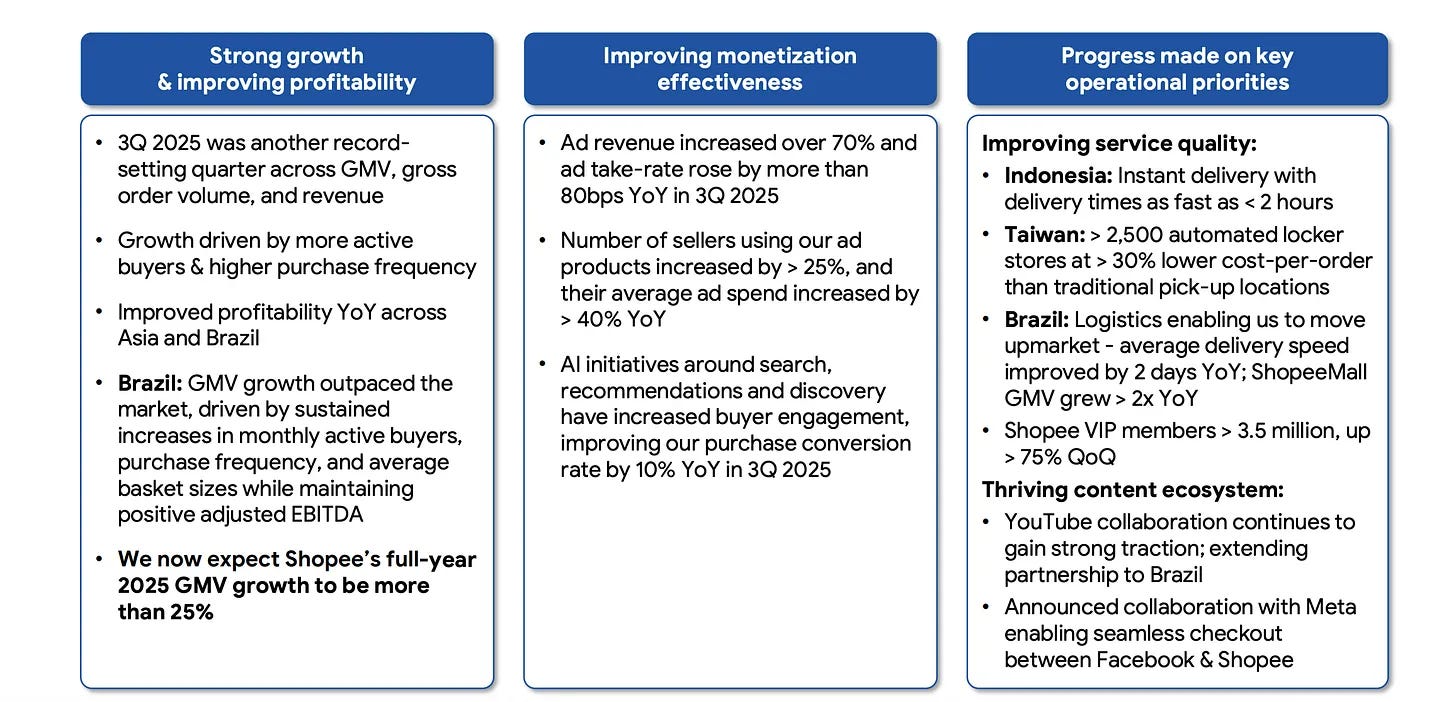
Sea told us ad revenue grew “over 70%” year-on-year and the ad take-rate improved by “more than 80 bps.” They also disclosed a total revenue take rate of 13.3%.
This is the classic playbook: Build density, get everyone addicted to the service, and then sell the high-margin ads. But—and this is a big but—it only works if the product actually gets better.
Management said ShopeeMall GMV more than doubled year-on-year in Brazil and delivery speeds improved by two days. That tells me the quality of demand is getting better. We aren’t just attracting bargain hunters; we’re attracting brand shoppers.
The Atomic Take: Shopee can afford ugly accounting optics (subsidies) as long as the monetization curve (ads) keeps bending upward faster than the costs.
Falsifier: If the take rate stalls out at 13.3% but they keep complaining about shipping subsidies, run for the hills. That means the moat is leaking.
2. DFS (Monee): The Silent Giant
This is the segment that keeps me up at night—in both good and bad ways. It deserves your attention.
DFS Revenue: $989.9m DFS Adjusted EBITDA: $258.3m
The loan book is $7.9bn (split $6.9bn on-book and $0.9bn off-book). The NPL90+ is 1.1%.

Those are clean numbers. But here’s the trap: Growth is fine until it isn’t. Management bragged about adding 5 million first-time borrowers and hitting 34m active users.
In the lending business, growth signals are great, right up until the moment they become “underwriting errors.”
DFS is the best business in the bundle right now because it monetizes the ecosystem. But if credit quality drifts—if that 1.1% NPL starts creeping up to 2% or 3%—the market will stop viewing Sea as a tech platform and start viewing it like a risky subprime lender.
Atomic Take: Watch the NPL line. If it stays boring, the stock works. If it moves, the narrative breaks.
3. Garena: The Swing Factor
Garena is the “Quality Upside.”
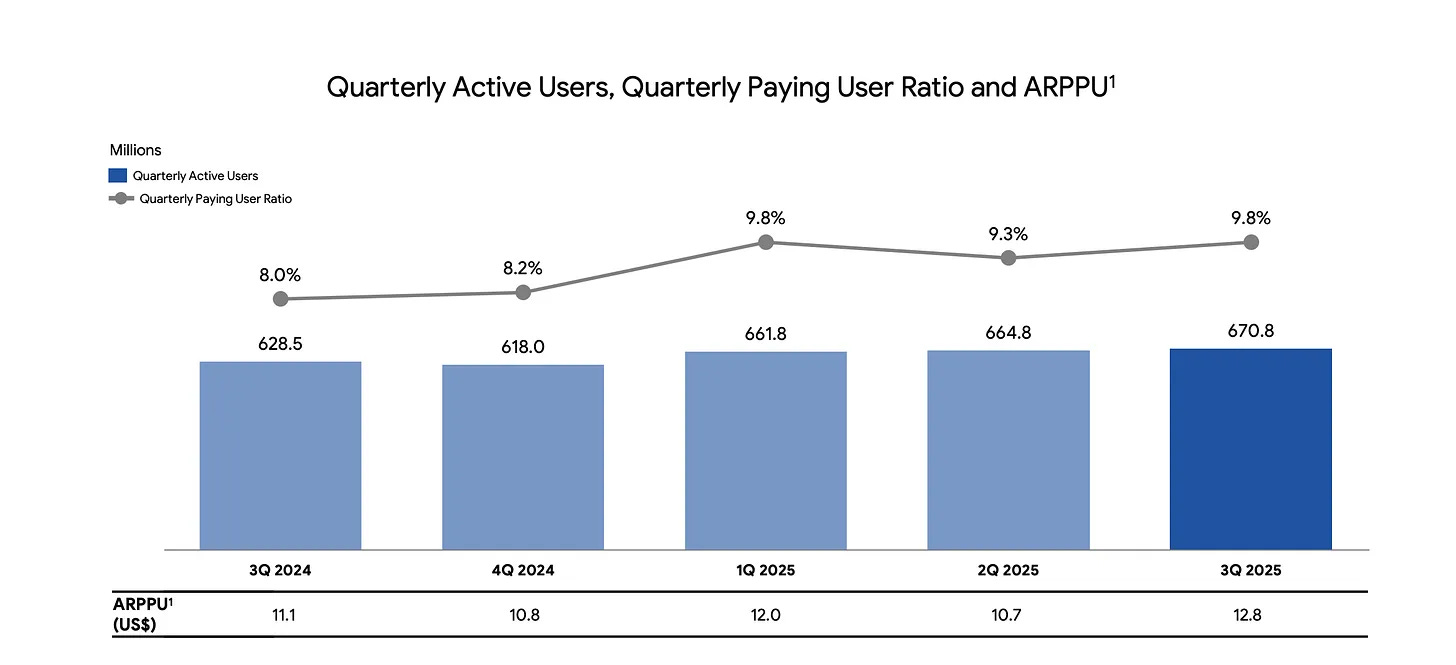
Bookings: $840.7m Adjusted EBITDA: $465.9m Paying Ratio: 9.8% ARPPU: $12.8

Management called this the “best quarter since 2021” and guided for 30% year-on-year bookings growth for 2025.
Here is the thing about gaming: It’s volatile. “Best since 2021” reminds us that there were some bad times between 2021 and now.
The constraint here is repeatability. Can they keep the paying ratio at 9.8% and ARPPU at $12.8? If those numbers hold up, Garena is a cash machine that funds the rest of the war. If the payers leave, Garena becomes a drag.
Atomic Take: Don’t just look at the bookings number. Look at the payer behavior. We want steady addicts, not just a one-time splash.
What Went Wrong (Or: Why the Market Gets Indigestion)
Let’s be clear: Sea didn’t crash the car. “What went wrong” isn’t about an operational disaster. It’s about a pattern of making smart business moves that look ugly on a spreadsheet.
The market hates ugly spreadsheets. It responds to “annoying optics” by demanding a discount.
1. The “Optics Bruise” on Purpose First off, Shopee is taking a punch to the face voluntarily. They explicitly tied the year-on-year decline in “value-added services revenue” to increased shipping subsidies.
Think of it like a restaurant giving away free appetizers to get you to buy the steak. The “appetizer revenue” looks terrible, but the restaurant is packed.
The Optic: “Value-added services revenue is down! Quality is deteriorating!”
The Reality: They are subsidizing shipping to drive throughput.
The Result: Investors spend all day arguing about the direction of the business when they should be arguing about the trade-off.
2. The “Gap” Where the Bears Live When you hand the skeptics a stick, don’t be surprised if they hit you with it. Sea’s earnings framing gives the bears plenty of wood.
Look at the spread:
Operating Income (GAAP): $475.9m
Total Adjusted EBITDA: $874.3m
Stop & Think: That is a massive gap. Almost double. When the “real” number and the “adjusted” number are that far apart, people get nervous.
The bridge between those two numbers isn’t trivial. It’s filled with heavy hitters:
D&A: $92.2m
Share-based Compensation (SBC): $154.2m
Deferred Revenue Changes (Net Effect): $151.9m
Even if every single one of those adjustments is 100% legitimate, a bridge that big makes “profitability” feel like a debate about definitions instead of a debate about economics. In a bundled model, you don’t just underwrite the results; you underwrite what the management wants you to look at. If Adjusted EBITDA is the headline and the bridge is the footnote, the skeptics will assume the footnote is where the bodies are buried.
3. The Three-Headed Monster Problem The bundle creates a permanent identity crisis. Sea is asking you to believe three impossible things before breakfast:
Commerce can scale while monetizing.
DFS (the bank) can scale while keeping credit boring.
Garena can contribute cash without turning into a volatile cycle trap.
When those three beliefs sit under one ticker, the market doesn’t average the risks. It prices the scariest one. If credit looks shaky, the whole company is priced like a bad bank. If gaming slows, the whole company is priced like a washed-up studio.
Atomic Take: Sea can execute perfectly and still get punished because complexity creates three different ways for confidence to break. The market prices the break, not the base case.
Falsifier: If GAAP operating income trends down materially from $475.9m while that EBITDA bridge stays huge, the “profitability” story falls apart.
The Catalysts (The Watch List)
You don’t need a crystal ball here. Sea gives you the gauges. You just have to watch them.
Catalyst 1: Shopee Monetization (The Cash Register)
The Test: Can they keep charging more?
The Baseline: Take rate is 13.3%. Ad revenue grew “over 70%” year-on-year. Ad take-rate improved “more than 80 bps.”
Catalyst 2: Quality Control
The Test: Are people happy with the service?
The Baseline: In Brazil, delivery speed improved by about two days year-on-year. ShopeeMall GMV (the branded stuff) more than doubled year-on-year.
Catalyst 3: The Boring Bank
The Test: Can DFS get bigger without blowing up?
The Baseline: Loans at $7.9bn. NPL90+ at 1.1%. (Boring is beautiful).
Catalyst 4: Garena’s Legs
The Test: Is the game still fun?
The Baseline: Bookings $840.7m, payer ratio 9.8%, ARPPU $12.8. Management reiterated expectations for more than 30% bookings growth for 2025.
FACT: Management expects FY2025 Shopee GMV growth to be more than 25% and 2025 Garena bookings growth to be more than 30%.
HYPOTHESIS: If Shopee grows that fast while monetization improves and the credit book stays clean, the “complexity discount” shrinks.
MONITOR: The three dials (Monetization, Credit Quality, Bookings). These change the lens.
Falsifier: If NPL90+ drifts materially above 1.1% while they keep bragging about loan growth, run.
Financial Quality Rubric (1–5)
Here is the scorecard. No fluff.
Scale + Growth Durability: 4/5
Shopee moving $32.2bn in GMV and 3.6bn gross orders is serious volume. Consolidated revenue is knocking on the door of $6bn. This isn’t a startup anymore; it’s a giant.
Profitability Under Reinvestment: 4/5
Posting $475.9m in GAAP operating income while eating the cost of shipping subsidies is impressive. It proves the model works even when they are spending to fight.
Cash Generation Quality: 3/5
This one is tricky. Read carefully. Operating cash flow (9M) was $3,548.1m. Looks great. But you have to look at where the cash went. Sea explicitly says the investing outflow was driven by a $3,355m increase in loans receivable.
Translation: They aren’t burning cash on fancy offices; they are “spending” cash to lend it out to customers. That’s inventory for a bank. It’s different from lighting money on fire, but it still eats cash.
Balance Sheet Simplicity: 3/5
It’s messy. You have $3,067.8m in cash plus restricted cash (current $1,963.2m / non-current $35.8m). But you also have the banking plumbing: $3,484.2m in deposits payable and $2,775.7m in escrow payables. It’s a real bank balance sheet now.
Credit Discipline Risk: 4/5
1.1% NPL90+ on a $7.9bn book is a clean baseline. The only reason it’s not a 5/5 is because they are growing the book so fast. Rapid growth is the enemy of underwriting.
Accounting / Optics Noise: 3/5
The “Gap” we talked about. The Adjusted EBITDA bridge has big numbers ($154.2m SBC, $151.9m deferred revenue). Plus, the “unallocated expenses” line invites people to cherry-pick the narrative.
Atomic Take: Sea is high quality, but it is not simple. The market charges a “simplicity tax.” Sea has to pay that tax until they prove they can do this for four quarters in a row.
Falsifier: If Operating Cash Flow trends down materially from $3,548.1m (9M) while loan growth is still the main driver and credit quality gets worse, the engine is stalling.
The Statements
Alright, it’s time to put on the reading glasses. We need to separate what’s liquid from what’s plumbing.
1. Balance Sheet (The Geiger Test)
In a normal retail business, you look at the cash pile and call it a day. But Sea isn’t normal. Sea reports cash & cash equivalents of $3,067.8m and restricted cash totaling $1,999.0m (current + non-current).
If this were just an online store, that would be a fortress. But it’s not just a store; it’s a bank. And banks have plumbing. Current liabilities include deposits payable of $3,484.2m and escrow payables/advances from customers of $2,775.7m.
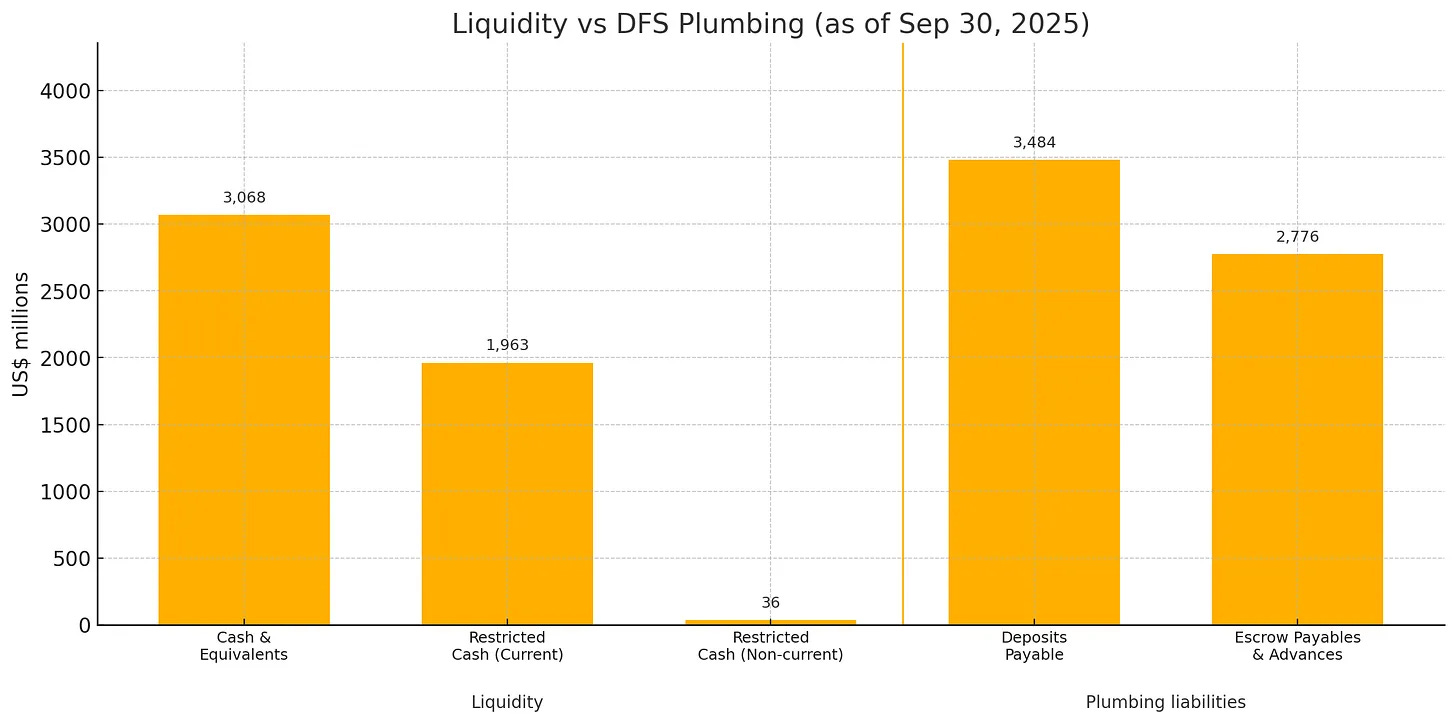
Stop & Think: Those liabilities aren’t debts in the traditional sense. They are the plumbing of a financial system. But they mean you can’t just look at the cash and say “Wow, look at all that spending money.”
The Audit: Investors love to treat “cash” like a single bucket. But DFS turns cash into a labeled ecosystem. Some cash is for fighting wars (operating flexibility), and some cash is just sitting there because regulators or customers insist it sits there.
Atomic Take: The balance sheet is strong enough to support compounding, but only if the plumbing stays boring. In banking, “boring” is the highest compliment. It means stable credit and stable funding.
Falsifier: If deposits/escrow liabilities rise materially but profitability tanks and credit quality rots, the plumbing is backing up.
2. Cash Flow (The Turbine)
This is where the amateur mistakes happen. Operating cash flow for the first 9 months was $3,548.1m. Investing cash flow was a negative ($3,255.1m). Financing cash flow was $617.6m. The net increase in cash was $985.2m, ending at $5,066.8m.
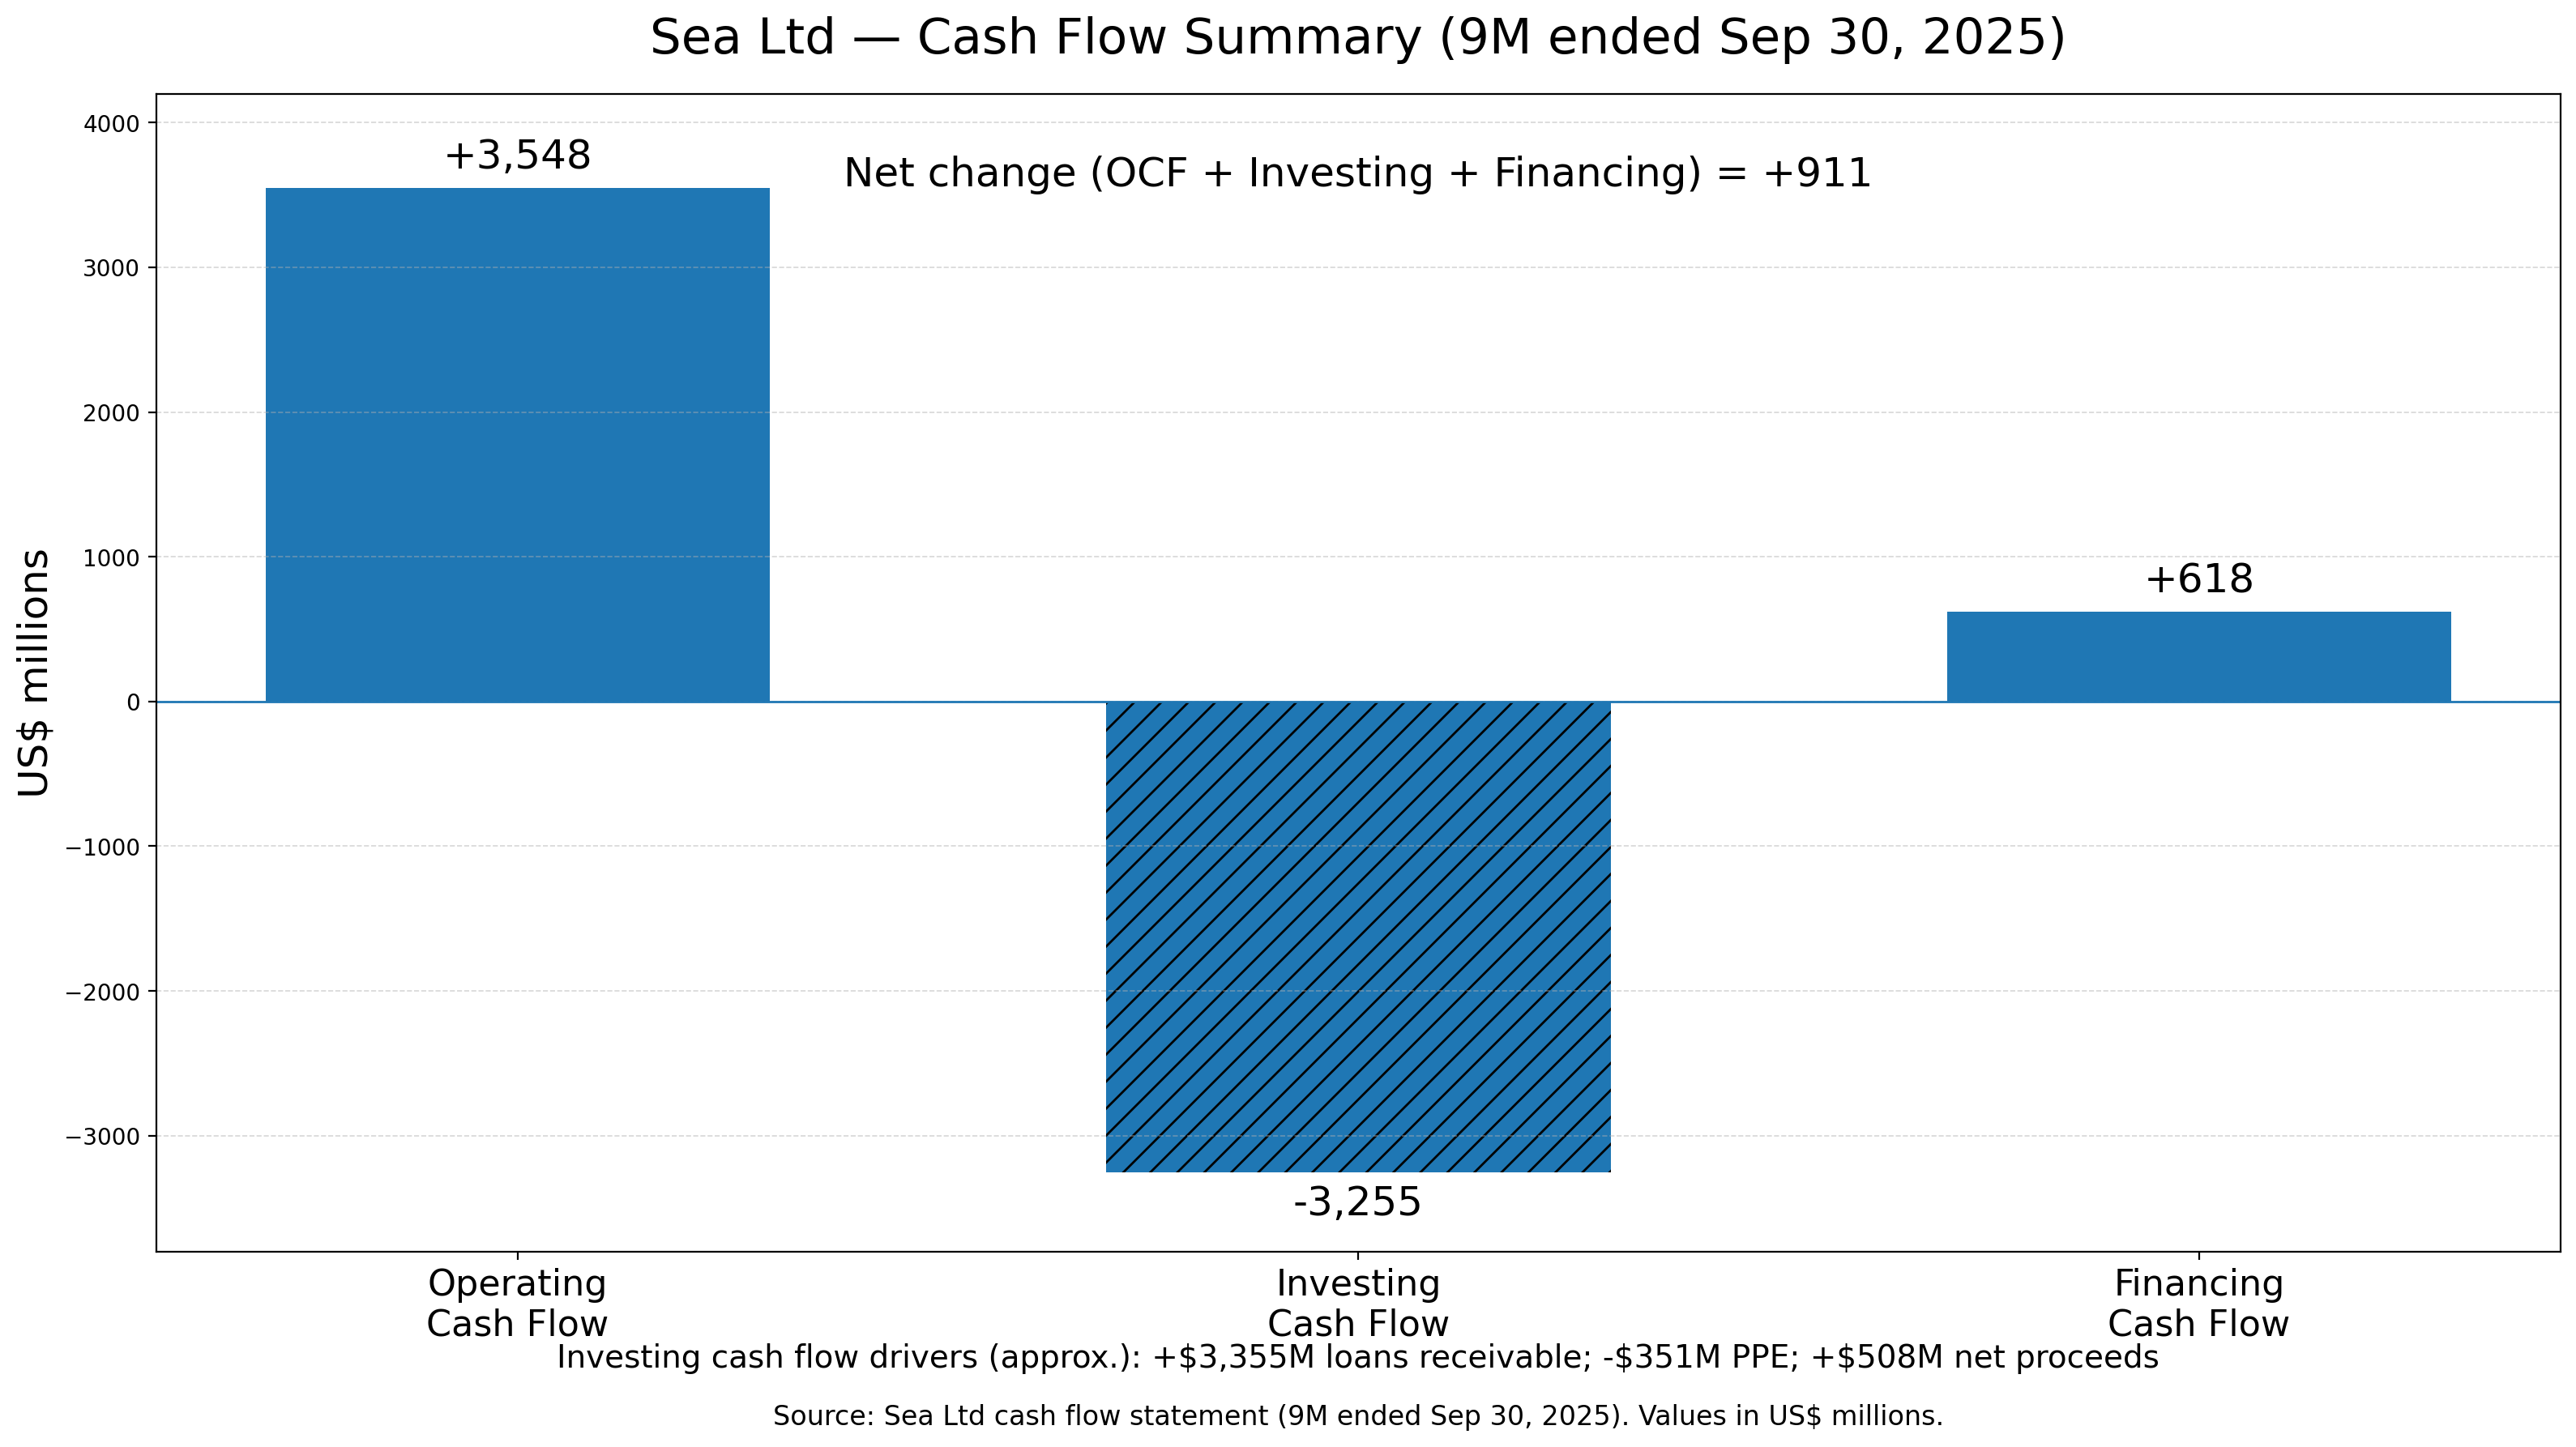
The “cash burn” debate ends right here. The turbine is spinning. The operating cash is strong. But wait, why is investing cash flow so negative? Is management on a shopping spree?
No. Sea explicitly says the investing outflow was primarily driven by an increase in loans receivable of $3,355m. PPE purchases (actual capex) were only $351m. (There was also $508m of net proceeds from treasury items).
Here is the translation: The company is generating cash from operations, and then choosing to recycle that cash into loan growth. The common error is to see “Investing Outflow” and scream “Capex Binge!” That’s wrong. The biggest absorber is loans receivable. That is DFS scaling up. It’s not spending; it’s allocating capital to inventory (loans).
Atomic Take: The turbine is working. The only debate is whether the power is being routed into compounding (good loans) or risk (bad loans).
Falsifier: If CFO (Cash Flow from Operations) stays high but NPL90+ rots while the loan book keeps growing, then we have a problem. Strong cash flow paired with bad underwriting is a trap.
3. Income Statement (The Reactor)
On the surface, it looks clean:
Revenue: $5,986.0m
Operating Income: $475.9m
Net Income: $375.0m
But check the bridge. Total Adjusted EBITDA was $874.3m. How do you get from $475m to $874m? You add back the “adjustments.”
D&A: $92.2m
SBC (Share-Based Comp): $154.2m
Deferred Revenue Effects: $151.9m
The Audit: In a multi-engine business like this, adjustments can become a crutch. If you only read the headlines, you see the EBITDA. If you read the footnotes, you see the bridge. The reconciliation is your checklist.
Atomic Take: The reactor is running hot. The argument is just about how much of the glow is structural profit and how much is accounting adjustments.
Falsifier: If GAAP operating income declines materially from $475.9m while adjusted EBITDA stays high because the bridge items got bigger, the “quality” of the earnings is degrading.
Valuation: What Are We Paying For?
At the time of this writing, Sea’s market cap is around $75.5bn.
Let’s do some napkin math using Q3 as a run-rate (arithmetic, not a forecast):
Net Income Run-Rate: $375.0m × 4 = $1.5bn.
Implies ~50x equity value / run-rate net income.
Adjusted EBITDA Run-Rate: $874.3m × 4 ≈ $3.5bn.
Implies ~22x equity value / run-rate adjusted EBITDA.
This is “Duration Math.” You aren’t paying 50x earnings for what they did yesterday. You are paying for the belief that the flywheel will spin for a long, long time.
For that multiple to make sense, three things must be true at once:
Shopee keeps monetizing without killing demand.
DFS keeps the credit boring while getting bigger.
Garena proves it’s not a one-hit wonder.
Atomic Take: At $75.5bn, you are not paying for “one good quarter.” You are paying for synchronized durability.
Falsifier: NPL90+ moves materially above 1.1% while loans principal outstanding keeps growing from $7.9bn AND GAAP operating income trends down from $475.9m. If that happens, the duration assumption breaks, and the multiple collapses.
Risks (The Meltdown List)
I keep this list taped to my monitor.
Credit Cycle Risk (The Fast Repricer)
Gauge: NPL90+ vs loans principal outstanding (baseline: 1.1% on $7.9bn).
Monetization Overshoot (The Tax Man)
Gauge: Take rate (13.3%) vs GMV ($32.2bn) and gross orders (3.6bn). If they tax the ecosystem too hard, the users leave.
Subsidy Creep (The Bad Habit)
Gauge: Continued shipping-subsidy talk without offsetting improvements in ads momentum.
Garena Cyclicality (The Fade)
Gauge: Bookings ($840.7m) vs payer ratio (9.8%) and ARPPU ($12.8).
Definitions Risk (The Bridge)
Gauge: Watch the gap between Operating Income ($475.9m) and Adjusted EBITDA ($874.3m). If the bridge grows, the quality drops.
Bundle Correlation Risk
The Nightmare Scenario: Shopee slows down, people stop paying back loans, and gamers stop playing, all at once.
The Atomic Verdict
Status: High Conviction (with caveats). Rating: 4.1 / 5.0 Stars.
Why it earns the rating: The bundle is finally profitable at scale.
Revenue: $5,986.0m
Operating Income: $475.9m
Net Income: $375.0m
Total Adjusted EBITDA: $874.3m
Shopee is showing it can monetize (13.3% take rate) while still fighting for market share. DFS is getting huge ($7.9bn loan book) while behaving responsibly (1.1% NPL).
What would increase my confidence? Give me two or three more quarters of this. If the loan book keeps growing without the NPLs spiking, and if Shopee keeps the ads machine humming, this stock goes higher.
What would make me wrong fastest? If NPL90+ moves materially above 1.1% while they keep pumping the loan book. That is the classic bank failure recipe.
Upgrade Triggers:
NPL90+ stays around 1.1% while loans scale past $7.9bn.
Shopee grows GMV past $32.2bn and orders past 3.6bn while keeping the take rate up.
Garena keeps bookings near $840.7m with stable payer ratios (9.8%).
Downgrade Triggers:
NPL90+ rises materially above 1.1%.
Operating Income trends down from $475.9m while the “Adjusted” numbers stay high (fake profit).
Shipping subsidies keep rising, but ad revenue slows down.
I’ve laid out the case. It’s a complex machine, but a profitable one.
Question for the comments: Do you trust a tech company to run a bank? Or is the lending arm a ticking time bomb inside the portfolio?
Reference Notes
Core quarter scoreboard, segments, KPIs
Sea Third Quarter 2025 Results (press release PDF), p.2: revenue 5,986.0m; operating income 475.9m; net income 375.0m; total adjusted EBITDA 874.3m; Shopee GMV 32.2bn; Garena bookings 840.7m; loans 7.9bn; NPL90+ 1.1%.
Sea Third Quarter 2025 Results Deck (PDF), p.7: segment revenue (4,294.8m / 989.9m / 653.0m) and segment profitability tables.
Sea Third Quarter 2025 Results Deck (PDF), p.10: Shopee GMV 32.2bn and gross orders 3.6bn chart.
Sea Third Quarter 2025 Results Deck (PDF), p.9: ads growth language (“over 70%”), ad take-rate improvement (“more than 80 bps”), and Brazil delivery speed / ShopeeMall mix highlights as presented.
Sea Third Quarter 2025 Results Deck (PDF), p.16: Garena bookings 840.7m; paying users 65.9m; paying ratio 9.8%; ARPPU 12.8; adjusted EBITDA 465.9m.
Sea Q3 2025 earnings call transcript: e-commerce revenue component commentary and subsidy explanation; management narrative on momentum and guidance language.
Cash flow and investing drivers
Sea Third Quarter 2025 Results report (PDF), p.16: CFO 3,548.1m; investing (3,255.1m); financing 617.6m; net increase 985.2m; ending cash+CE+restricted 5,066.8m; investing drivers (loans receivable +3,355m; PPE 351m; net proceeds 508m).
Balance sheet plumbing
Sea Third Quarter 2025 Results report (PDF), p.14: deposits payable 3,484.2m; escrow payables/advances 2,775.7m; cash and restricted cash labels (as of Sept 30, 2025).
Adjusted EBITDA reconciliation bridge
Sea Third Quarter 2025 Results report (PDF), reconciliation page: D&A 92.2m; SBC 154.2m; deferred revenue effect 151.9m; operating income to adjusted EBITDA bridge.
Disclaimer
This Deep Dive is an educational breakdown of a public company based on information available in the materials provided (e.g., annual/quarterly reports, investor presentations, earnings transcripts) and my interpretation of that information. It is designed to be a “bolt-on” intelligence layer to your own due diligence — not a replacement for it.
Independence: I do not accept compensation of any kind from the companies discussed. My research is driven solely by my personal search for high-quality compounders.
Skin in the Game: Unless otherwise stated, assume the author may hold a long position in securities mentioned. Any position creates bias — treat this as commentary, not gospel.
Not Financial Advice: Nothing here is investment advice, a recommendation, or a solicitation. I am not a financial advisor. You are responsible for your own decisions.
Error & Update Risk: Financial statements change, companies restate, guidance evolves, and I can be wrong. Verify key figures in the primary filings and consider reading the footnotes before deploying capital.