

The Atomic Moat FINS Analysis: AST Spacemobile (ASTS)
AST SpaceMobile is trying to turn “no signal” into “full bars” using physics, patience, and a truly industrial amount of capital.


They say “Space is hard.” Judging by these financials, space is also incredibly expensive. AST SpaceMobile is trying to build a cell tower in the sky, and they are burning cash faster than a rocket booster on reentry.
1 Analytical Scope: Financials Only. This report stress-tests the balance sheet, not the satellite technology. It answers "Can they afford to build it?"—not "Will it work?"
The Setup
This is a satellite company pretending to be a mobile network upgrade.
AST SpaceMobile is designing, developing, and manufacturing BlueBird satellites to deliver cellular broadband directly to standard, unmodified phones via a LEO constellation.
Right now, it’s still pre-commercial on the core service: the 10-Q says they have not generated revenues from SpaceMobile Service to date.
Q3 2025 revenue was $14.7m (GAAP), driven by U.S. government milestones and gateway deliveries/resale.
This is a moonshot with receipts.
[ASTS][REPORTED (GAAP)][Q3 2025] KEY STATS

REVENUE (USDm)...........14.7
TOTAL OPERATING EXPENSES (USDm)...........94.4
NET LOSS ATTRIB. TO COMMON (USDm)...........(122.9)
NET LOSS PER SHARE (USD)...........(0.45)
CASH & CASH EQUIV (USDm)...........1,204.3
Personal Stake: No position
What the market thinks right now (Bulls vs Bears)
Market: “Either it works and rewrites coverage maps, or it becomes an expensive science fair.”
Bull: “$1.0b+ of contracted revenue commitments and new definitive commercial agreements mean demand isn’t theoretical.”
Bear: “The burn is real, the schedule is tight, and regulatory approvals can still hit the brakes.”
Atomic Take: A company can be technically right and financially early, and ASTS is currently both.
What breaks this: If the company can’t convert the partner momentum into recurring service revenue after the planned initial activations, the story becomes “permanent pilot.”
Balance Sheet (The Geiger Test)
This balance sheet is a war chest sitting on top of a build site.
As of September 30, 2025, ASTS reported $1.2b cash and cash equivalents plus restricted cash of $15.8m (GAAP).
Total assets were $2.6b as of September 30, 2025, with property and equipment, net at $1.0b and intangibles, net at $213.8m.
Long-term debt, net was $697.6m as of September 30, 2025.
The Geiger counter clicks because execution risk is an asset class here.
[ASTS][REPORTED (GAAP)][AS OF 30 SEP 2025] KEY STATS

CASH & CASH EQUIV (USDm)...........1,204.3
RESTRICTED CASH (USDm)...........15.8
PROPERTY & EQUIPMENT, NET (USDm)...........1,007.8
INTANGIBLE ASSETS, NET (USDm)...........213.8
LONG-TERM DEBT, NET (USDm)...........697.6
The Audit:
Optical illusion #1 — cash looks like “runway,” but the capex machine is already running and the commitments are big.
Optical illusion #2 — some major payments tied to spectrum are structured as commitments contingent on approvals/closing, so “not on the balance sheet” isn’t the same as “not real.”
Atomic Take: This is a strong liquidity picture for a pre-commercial business, but it’s designed to be spent.
What breaks this: If regulatory approvals for key spectrum arrangements slip and the spend continues, liquidity stops being strength and starts being a countdown.
Cash Flow (Energy Output)
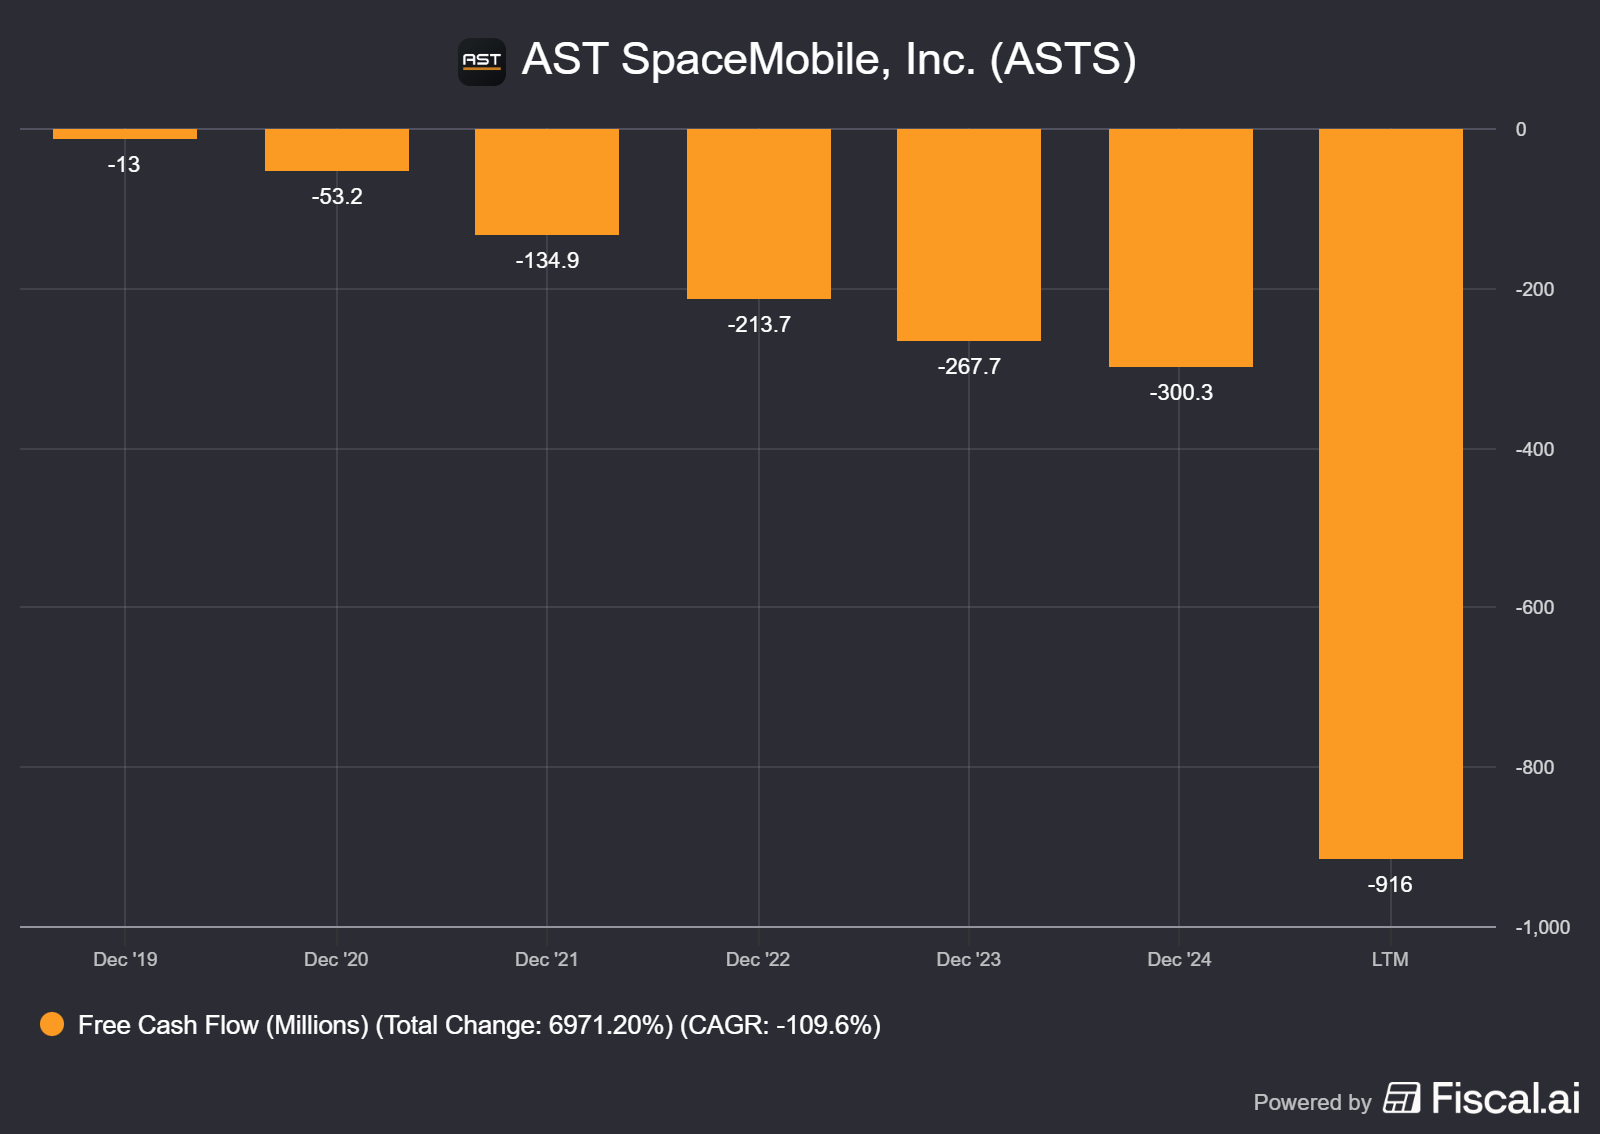
This reactor is currently consuming fuel, not producing electricity.
For the nine months ended September 30, 2025, cash used in operations was $(136.5)m (GAAP).
Cash used in investing was $(697.0)m, driven mainly by purchases of property and equipment and spectrum usage rights payments.
Financing supplied $1.5b in the same period, reflecting debt and equity activity.
The company is buying time with capital markets.
[ASTS][REPORTED (GAAP)][9M 2025] KEY STATS

CASH USED IN OPS (USDm)...........(136.5)
PURCHASE OF P&E (USDm)...........(669.0)
SPECTRUM INTANGIBLES (USDm)...........(28.0)
CASH AFTER INVESTMENTS (USDm)...........(833.5) (OPS - P&E - SPECTRUM)
CASH PROVIDED BY FINANCING (USDm)...........1,487.1
The Audit: Management explicitly attributes higher operating cash use to increased expenses plus working capital movement, which is what “scaling” looks like before revenue arrives.
Atomic Take: The cash burn is coherent with the mission, but it only pays off if launches + commercialization stay on track.
What breaks this: If “cash after investments” stays deeply negative while timelines slip, dilution risk becomes the default funding plan.
Share Capital & Insiders (Nucleus Check)
This equity story is an engineering schedule wearing a ticker symbol.
As of September 30, 2025, Class A shares outstanding were 271,981,894 (GAAP), with additional non-economic Class B and Class C vote shares outstanding.
The company’s equity roll-forward shows multiple equity-related events in 2025 including share issuance, warrant exercises, and settlements tied to convertible notes.
The nucleus is stable only if funding remains cheap enough to keep fissioning.
[ASTS][REPORTED (GAAP)][AS OF 30 SEP 2025] KEY STATS

CLASS A SHARES OUTSTANDING (COUNT)...........271,981,894
CLASS B SHARES OUTSTANDING (COUNT)...........11,227,292
CLASS C SHARES OUTSTANDING (COUNT)...........78,163,078
OPTIONS OUTSTANDING (COUNT)...........4,990,984 (AST LLC INCENTIVE PLAN)
POTENTIAL SHARES EXCLUDED FROM EPS (COUNT)...........11,683,475 (CONVERTS, AS-CONVERTED)
Atomic Take: The share count is already doing heavy lifting, and future dilution is the tax you pay for going fast.
What breaks this: Another major equity raise before initial service activation would signal the timeline slipped or the cost curve got worse.
Income Statement (Reaction Chamber)
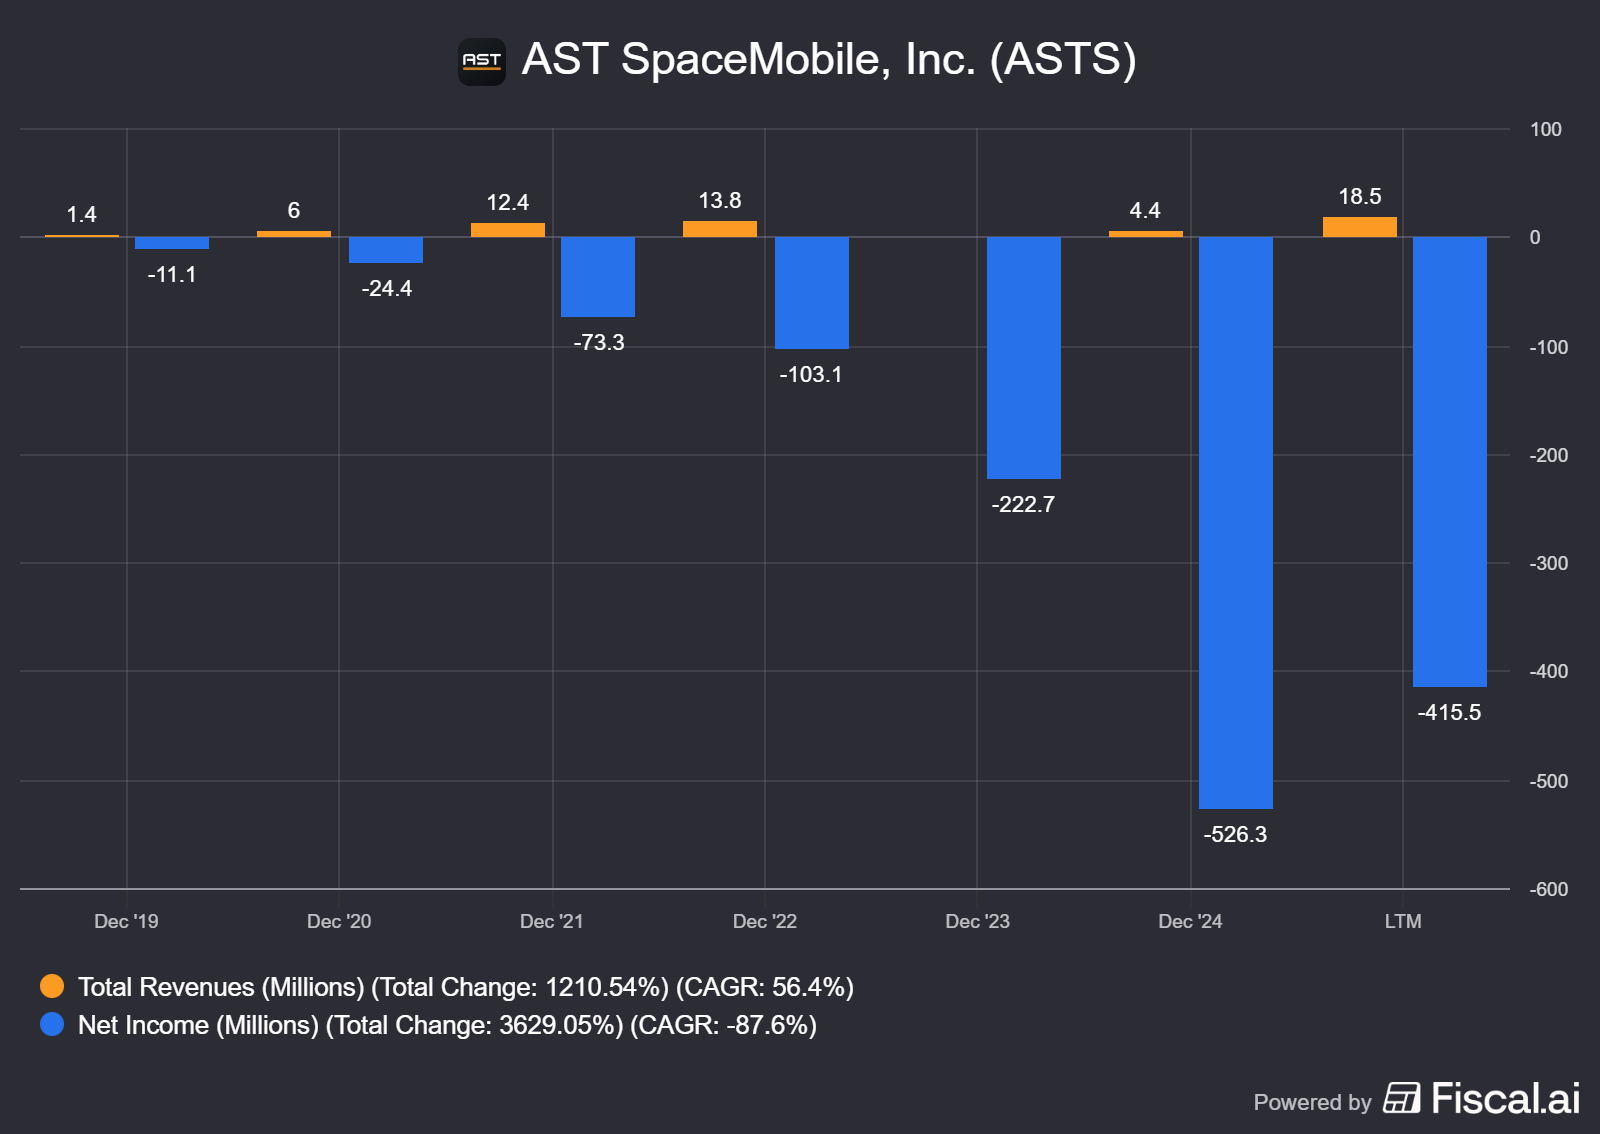
The income statement is still mostly “expenses now, product later.”
Q3 2025 revenue was $14.7m (GAAP), while operating expenses were $94.4m.
For the nine months ended September 30, 2025, revenue was $16.6m (GAAP), and management describes it as mainly government contract performance obligations plus gateway equipment/software resale to MNOs.
Net loss attributable to common stockholders was $(268.0)m for the nine months ended September 30, 2025.
This is a P&L built for a future launch date.
[ASTS][REPORTED (GAAP)][9M 2025] KEY STATS

REVENUE (USDm)...........16.6
TOTAL OPERATING EXPENSES (USDm)...........232.0
NET LOSS ATTRIB. TO COMMON (USDm)...........(268.0)
INTEREST INCOME (USDm)...........28.5
INTEREST EXPENSE (USDm)...........(17.9)
Quick Hits
• R&D expense fell year-on-year because the company cites completion of its ASIC chip development.
• Depreciation and amortization fell year-on-year as BW3 became fully depreciated in 2024, with Block 1 dynamics changing the mix.
• The company recorded induced conversion expense tied to repurchases of the 2032 4.25% converts.
No vibes allowed.
This is the scorecard. Each card separates what’s true today from what could happen next, then names the one signal that will prove it either way.”
Signal 1: Activation → Revenue
🔒 FACT: Nationwide intermittent service planned (US), more activations early 2026.
🧠 HYPOTHESIS: Activations become repeatable service revenue, not demos.
📈 MONITOR: Mix shifts from gateways/contracts toward service; revenue vs Q3 baseline.
Signal 2: Spectrum → Approvals
🔒 FACT: Spectrum arrangements include approval/closing dependencies.
🧠 HYPOTHESIS: Approvals land on time without economics changing.
📈 MONITOR: Approval disclosures + contingent payment milestones (Verizon prepay language).
Signal 3: Commitments → Conversion
🔒 FACT: $1.0b+ contracted revenue commitments; Verizon + stc cited.
🧠 HYPOTHESIS: Commitments convert to contracted service revenue as constellation scales.
📈 MONITOR: Deployment cadence + constellation size milestones.
Atomic Take: The business case is getting commercial scaffolding, but the P&L won’t look “normal” until service revenue exists.
What breaks this? If expenses keep rising while the revenue base stays anchored to gateways and contracts, operating leverage becomes a myth.
The Atomic Verdict
This is a binary-ish outcome wrapped in a very liquid balance sheet.
• Quality: Real technical validation and partner momentum, but the product is not yet a recurring service line in reported revenue.
• Health: $1.2b cash on-book plus significant pro forma liquidity gives runway, but it’s paired with a build schedule and debt.
• Overhang: Regulatory approvals, launch execution, and sustained capex intensity remain the obvious overhangs.
• What must happen next: Initial activations must convert into measurable service revenue traction while deployment continues.
(Binary outcomes are a theme in the ‘New Space’ race. Just like Intuitive Machines (LUNR), this is a coin flip: heads you win big, tails you get diluted.)
Status: Hazardous — RADIOACTIVE
Stars: ★★☆☆☆
Reason 1: Huge liquidity and strong partner signaling.
Reason 2: Still pre-commercial on the core service, with heavy cash burn.
Upgrade Triggers
• Second-half 2025 revenue lands within the reiterated $50.0m–$75.0m guidance range.
• Clear evidence that initial activations transition into repeatable service revenue disclosures (not just milestone revenue).
• Investing cash use moderates versus 9M 2025 capex-like spend while deployment remains on schedule.
Downgrade Triggers
• Regulatory approval delays that push contingent spectrum-related milestones or commercial prepayment conditions out materially.
• Cash after investments stays near the 9M 2025 $(833.5)m burn rate without matching commercialization traction.
• Additional large financing raises needed before initial activations expand, implying the cost curve outran the plan.
Disclaimer
The content within Atomic Moat Research is designed to be a “bolt-on” intelligence layer to your own due diligence, not a replacement for it. I conduct these deep dives to decode financial statements and valuation models for the rational retail investor.
Independence: I do not accept compensation of any kind from the companies I review. My research is driven solely by my personal search for high-quality compounders.
Skin in the Game: Unless otherwise stated, assume the author holds long positions in the assets discussed. I invest my own real capital alongside my analysis. This creates a bias you should be aware of. While I strive for institutional-grade depth based on the most recent filings, my opinions are my own. I am not a financial advisor. All readers are encouraged to perform their own due diligence prior to deploying capital.
Note on Scope: This analysis is strictly a financial stress test, evaluating AST SpaceMobile through the lens of accounting, liquidity , and capital structure. It explicitly excludes assessment of engineering feasibility, satellite physics, and technical validity. For "Deep Tech" companies, a sustainable cash burn rate does not guarantee that the underlying technology will function as intended.