

The Atomic Moat FINS Analysis: Innodata Inc. (INOD)
Innodata is what happens when “picks and shovels” stops being a metaphor and starts being a quarterly line item.


The market loves the AI gold rush—until it remembers shovels can be rented, projects can end, and your biggest customer can ghost you.
The Setup
Innodata’s current story is basically: Digital Data Solutions (DDS) is the engine, and “generative AI services” is the fuel. Management frames the company as a “picks and shovels” beneficiary with contracts with five of the “Magnificent Seven,” plus a wider platform narrative that spans LLM annotation, evaluation, and enterprise workflow tools.
But the filings read with less poetry and more fine print: DDS revenue is largely project-based, and contracts are primarily at-will—customers can reduce, delay, or cancel projects. The company explicitly flags DDS’s revenue concentration in a limited number of customers as a risk.
Q3 2025 delivered $62.6m revenue (US GAAP) and $8.3m net income (US GAAP), with Adjusted EBITDA of $16.2m (non-GAAP). The headline looks “down” vs last year’s EPS, but last year’s quarter included a meaningful tax benefit tied to NOL utilization.
Under the hood, this is still a DDS-dominant company (about ~90% services vs ~10% SaaS per the investor materials), with Agility (media intelligence) and Synodex (medical data intelligence) currently more like side quests than main campaigns.
[Q3 2025] KEY STATS

REVENUES (USD)..............62.6m
GROSS MARGIN................41%
ADJ EBITDA (USD)............16.2m
NET INCOME (USD)............8.3m
BASIC EPS (USD).............0.26
Balance Sheet (The Geiger Test)
As of 30 Sep 2025, Innodata reported $73.9m cash and cash equivalents (US GAAP) and $75.3m working capital. Management states this is sufficient for at least the next 12 months (liquidity, not destiny).
The big balance-sheet “tell” is accounts receivable: $39.4m net (US GAAP) as of 30 Sep 2025, up from $28.0m as of 31 Dec 2024.
Liabilities are not scary, but they’re not zero either: operating lease liabilities total $4.7m (US GAAP) and long-term obligations total $8.8m (US GAAP), largely pension obligations plus a Microsoft license commitment.
Credit-wise, the revolving facility exists (up to the lesser of borrowing base and $30.0m, with an option to request an increase up to $50.0m), it requires a fixed charge coverage ratio of not less than 1.10 to 1.00, and would price at daily simple SOFR + 2.25% if drawn. They didn’t use it during the nine months ended 30 Sep 2025, or through the filing date.
Also worth clocking: there’s a long-running Philippines judgment exposure described (potential payment ~$5.6m, plus interest that continues to accrue at 6% after mid-2013, with FX sensitivity). It may never bite, but it’s a live wire.
[INOD][US GAAP][AS OF 30 SEP 2025] KEY STATS

CASH & EQ (USD).............73.9m
ACCOUNTS REC, NET (USD).....39.4m
TOTAL ASSETS (USD)..........152.9m
TOTAL LIABILITIES (USD).....55.7m
LT OBLIGATIONS (USD)........8.8m (INCL CURRENT 1.2m)
The Audit: This balance sheet looks like a bunker until you notice 58% of accounts receivable (US GAAP, as of 30 Sep 2025) is due from one customer—cash is strong, but collection risk is not diversified.
“No debt” vibes get thrown around in investor narratives, but the filing still carries pension obligations and lease liabilities—manageable, yes; nonexistent, no.
Atomic Take: Liquidity is real, but the Geiger counter clicks loudest near receivables concentration.
Falsifier: If the company can grow while AR concentration and the “one-customer” % meaningfully fall (not just because revenue fell), the balance-sheet risk profile improves in a measurable way.
Cash Flow (Energy Output)
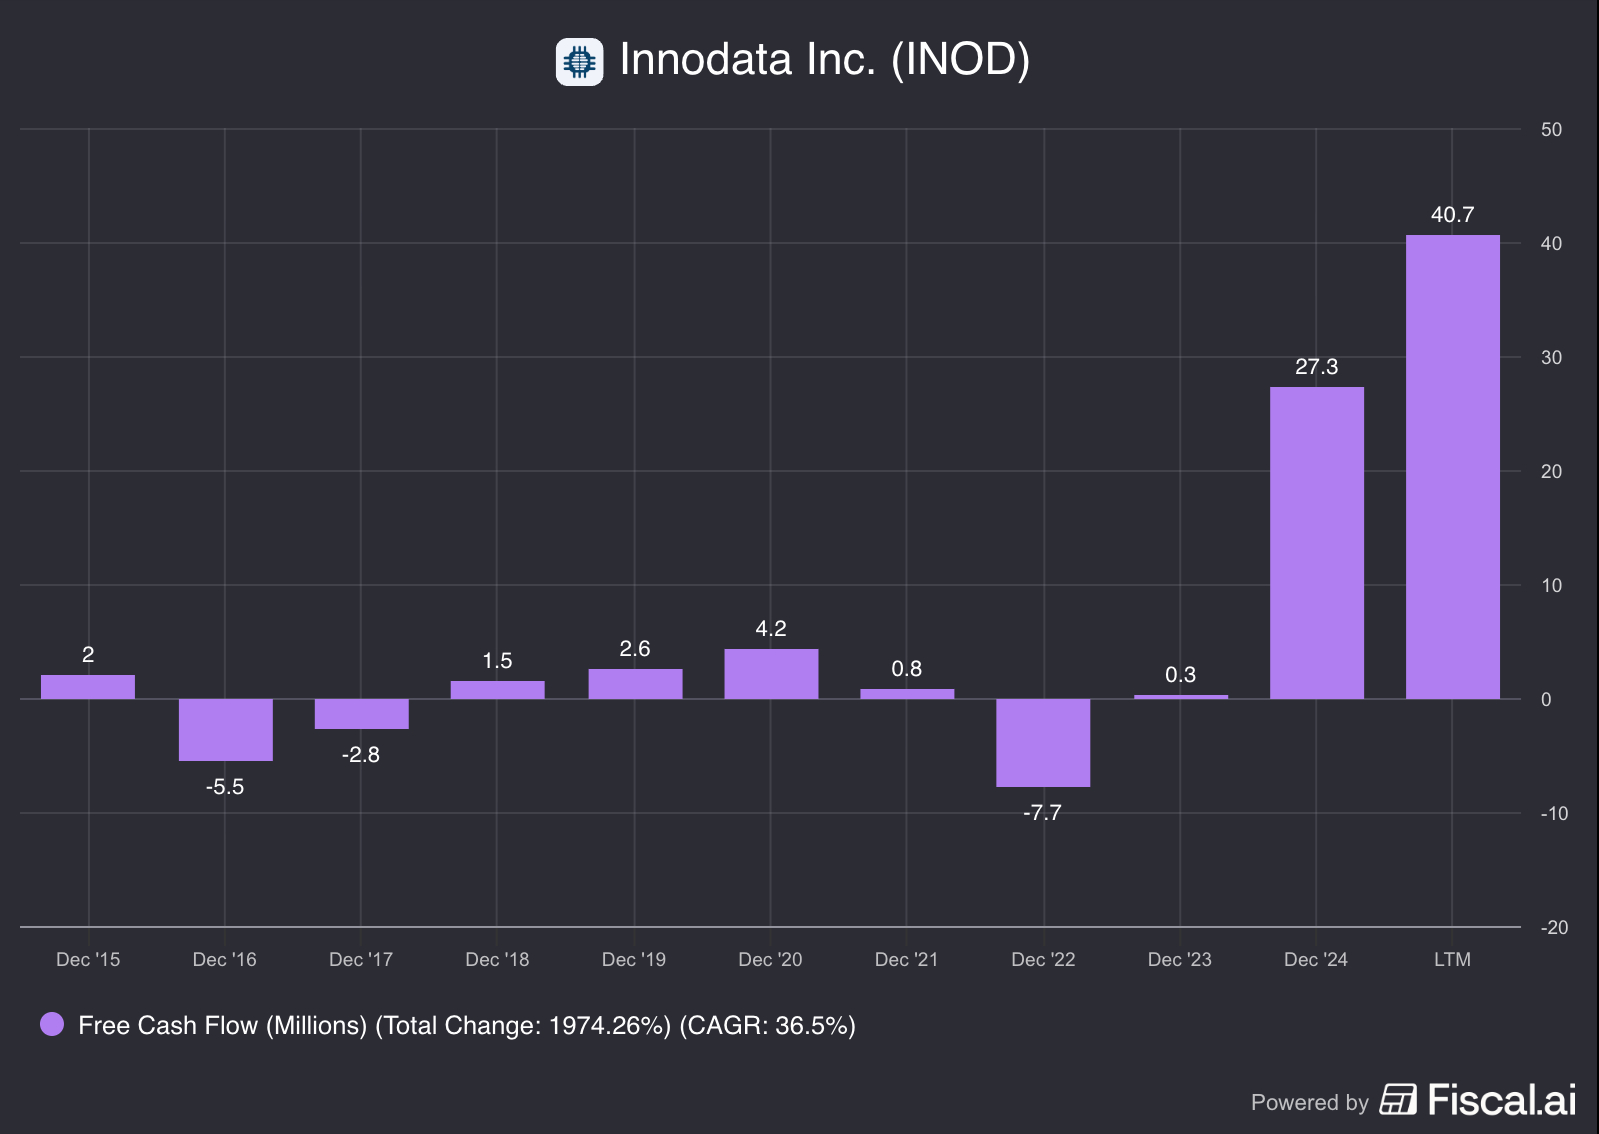
For the nine months ended 30 Sep 2025, cash from operations was $33.9m (US GAAP), built from $23.3m net income (US GAAP), plus $17.4m non-cash items, offset by a $6.8m working-capital cash use. Management explicitly calls out receivables as the driver of the working-capital use.
Capex-like investments (actual investing capex, not “investing cash flow”) were $8.3m (US GAAP) for the same nine-month period, primarily technology equipment, infrastructure, and capitalized developed software—split $5.6m DDS, $1.8m Agility, $0.9m Synodex. Management anticipates about $11.0m of capex in the next 12 months, with a portion potentially financed.
Net: this business is currently converting earnings into cash, but it’s also spending to scale capacity—which is fine as long as demand isn’t a single-project mirage.
[INOD][US GAAP][9M 2025] KEY STATS

NET INCOME (USD)............23.3m
CASH FROM OPS (USD).........33.9m
CAPEX (USD).................8.3m
CASH AFTER INVEST (USD).....25.6m (CASH FROM OPS - CAPEX)
STOCK-BASED COMP (USD)......8.3mThe Audit: Cash from ops got help from non-cash items (including higher deferred tax provision and higher share-based comp), while working capital moved against them via receivables—so don’t confuse “cash this year” with “cash with perfect customer behavior.”
Atomic Take: The cash engine runs, but it’s still partially powered by accounting add-backs and working-capital timing.
Falsifier: If cash from ops stays strong while receivables stop being the recurring drag (i.e., working capital turns supportive instead of consumptive), the cash-quality critique weakens.
Share Capital & Insiders (Nucleus Check)
Share count has been creeping up: the company reported 31,860,951 shares outstanding as of 31 Oct 2025.
As of 30 Sep 2025, the filing shows 35,043,000 shares issued and 31,859,000 shares outstanding (with 3,184,000 treasury shares). Additional paid-in capital increased alongside stock-based compensation and option exercises.
Dilution math matters here because the compensation machinery is active: total stock-based compensation was $2.7m in Q3 2025 and $8.3m in the first nine months of 2025 (US GAAP).
On the instruments: the company disclosed options to purchase 3.6m shares and 390,569 restricted stock units included in diluted EPS computation as of 30 Sep 2025. It also disclosed ~$6.4m of unrecognized compensation cost related to non-vested stock options at 30 Sep 2025.
[INOD][US GAAP][AS OF 30 SEP 2025] KEY STATS

SHARES OUTSTANDING..........31.859m
TREASURY SHARES.............3.184m
DILUTIVE OPTIONS............3.6m
DILUTIVE RSUS...............390,569
UNREC. OPTION COMP (USD)....6.4m
Atomic Take: This isn’t “toxic dilution,” but it is a very real equity bill—paid quarterly—so your per-share thesis needs to outrun it.
Falsifier: If share-based comp meaningfully declines as a % of revenue without choking growth (or if the company starts consistently offsetting dilution), the per-share risk moderates.
Income Statement (Reaction Chamber)
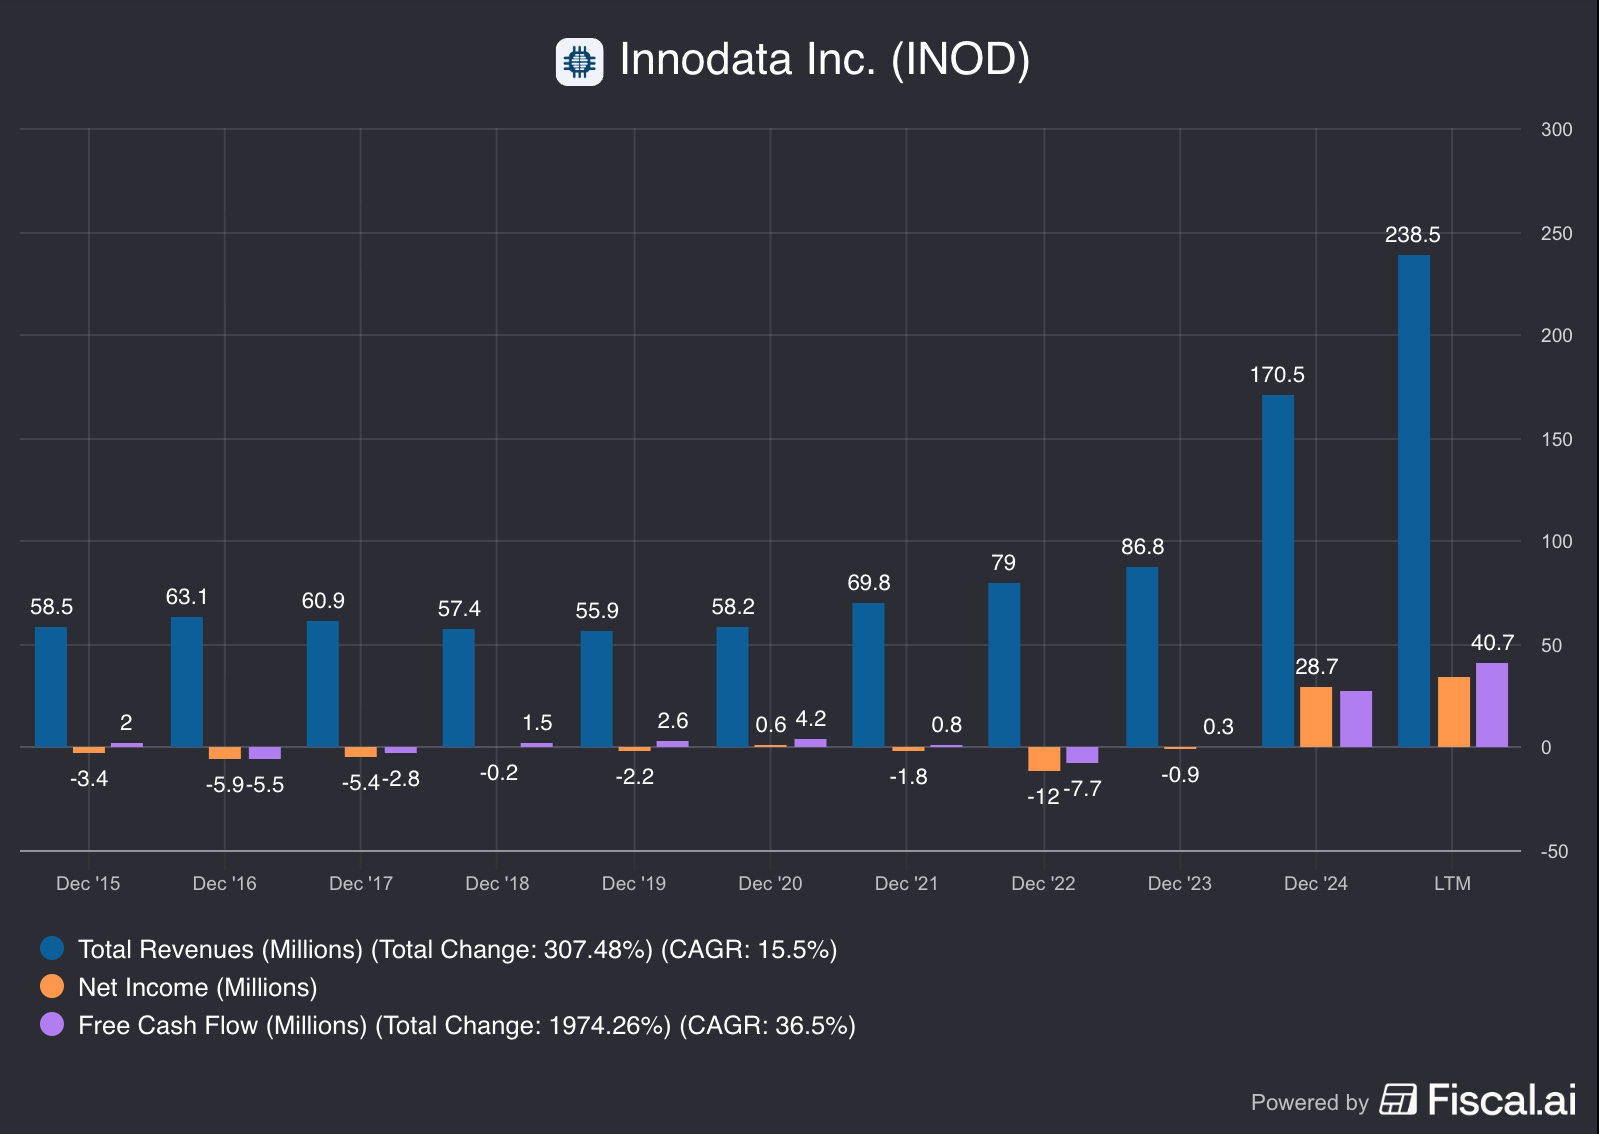
Revenue is growing fast in the aggregate:
Q3 2025 revenue $62.6m (US GAAP) was up 20% YoY on an “organic” basis.
September YTD 2025 revenue $179.3m (US GAAP) was up 61% YoY on the same basis.
DDS revenue was $54.8m (US GAAP) in Q3 2025
$156.2m (US GAAP) for the nine months ended 30 Sep 2025, versus Agility at $6.2m / $18.0m and Synodex at $1.6m / $5.1m.
Management attributes DDS’s revenue increase largely to growth in revenue from existing customers (including certain large technology customers), tied to additional machine learning services; they also note a key DDS customer accounted for 56% of total revenue in Q3 2025 and 58% in the first nine months of 2025 (US GAAP).
Margins are holding up (and improving YTD): consolidated gross margin was 41% in Q3 2025 and 40% for the first nine months of 2025 (US GAAP). Adjusted gross margin was 44% and 43% respectively (non-GAAP).
Profitability looks strong on an Adjusted EBITDA basis ($16.2m Q3; $42.2m 9M, non-GAAP), but GAAP net income is the one that got “headline-whiplashed” because Q3 2024 included a tax benefit; Q3 2025 recorded an income tax provision of $3.8m versus a $5.9m tax benefit in the prior-year quarter (US GAAP).
Uncertainty check (because DDS is project-based and at-will):
FACT: DDS contracts are primarily at-will and project-based, and the company highlights the ability of customers to reduce, delay, or cancel projects.
HYPOTHESIS: If Innodata’s work is increasingly embedded across customer workflows (pre-training, post-training, evaluation) as management suggests, the “project treadmill” becomes less volatile over time.
MONITOR: Customer concentration percentages (revenue + AR) and whether large-customer expansions translate into billed, collectible revenue rather than “verbal confirmation” narrative.
[INOD][US GAAP][9M 2025] KEY STATS

REVENUES (USD)..............179.3m
GROSS MARGIN................40%
ADJ EBITDA (USD)............42.2m
NET INCOME (USD)............23.3m
DDS REVENUE (USD)...........156.2m
Atomic Take: The income statement is genuinely strong—but it’s strong in a way that makes “customer concentration” the central investment variable, not a footnote.
Falsifier: If Innodata sustains growth while the top customer’s revenue share drops materially below the current band (and segment margins stay intact), the “single-throttle” risk is reduced.
The Atomic Verdict
• Quality: DDS execution + sustained gross margin (41% Q3 2025; US GAAP) suggest real operating competence, not just a one-off spike.
• Health: $73.9m cash (US GAAP, as of 30 Sep 2025) and an undrawn revolver reduce near-term financing risk.
• Overhang: DDS customer concentration is extreme (58% of 9M 2025 revenue; US GAAP) and shows up again in receivables concentration—this is the reactor rod you keep your hand near.
• What must happen next: Convert “transformative 2026” talk into diversified, collectible revenue—without paying for growth with endless SBC and receivables bloat.
Status Label: Overhang-Heavy.
Status: CRITICAL MASS.
★★★★☆ (4/5) — because cash is real and margins are holding, but concentration risk is still the plot twist.
Upgrade Triggers:
Top-customer revenue concentration (US GAAP) steps down materially from 58% while total revenue continues to grow (measured over multiple quarters).
Cash-from-ops remains strong with improving working-capital behavior (receivables no longer the persistent drag).
Stock-based compensation (US GAAP) declines as a percentage of revenue while maintaining operating momentum.
Downgrade Triggers:
Any sharp revenue deceleration paired with continued high customer concentration (i.e., the big customer sneezes and the whole P&L catches it).
Accounts receivable grows faster than revenue again, implying collection strain or billing friction.
Capex and capacity build continue to rise toward management’s $11.0m expectation without clear evidence of diversified demand.
While Innodata handles the software side of AI infrastructure, the power demands are creating winners in the energy sector. See my analysis of Iren (IREN) for a look at the data center side of the equation
Disclaimer
The content within Atomic Moat Research is designed to be a “bolt-on” intelligence layer to your own due diligence, not a replacement for it. I conduct these deep dives to decode financial statements and valuation models for the rational retail investor.
Independence: I do not accept compensation of any kind from the companies I review. My research is driven solely by my personal search for high-quality compounders.
Skin in the Game: Unless otherwise stated, assume the author holds long positions in the assets discussed. I invest my own real capital alongside my analysis. This creates a bias you should be aware of. While I strive for institutional-grade depth based on the most recent filings, my opinions are my own. I am not a financial advisor. All readers are encouraged to perform their own due diligence prior to deploying capital.