

The Atomic Moat FINS Analysis: TSS Inc (TSSI)
Sometimes the scariest thing in small-cap land isn’t the debt. It’s the fact that your entire business fits inside one customer relationship.

The Setup
TSS, Inc. (TSSI) is basically three businesses wearing one hard hat:
Procurement (they source third-party hardware/software)
Systems integration (they build/configure racks)
Data-center gear), and facilities management (design, deploy, and maintain modular/data-center stuff)
The story twist is the “AI rack integration” ramp. They began integrating AI racks in June 2024 and kept at it through the current quarter.
In May 2025 they moved HQ/production to Georgetown, Texas, then went full operations in June. They say they’ve put about $35.1m into leasehold improvements for power/cooling (including direct liquid cooling capability).
This is a company that can look like a rocket ship… and still be a one-string violin.
[TSSI][REPORTED (GAAP)][Q3 2025] KEY STATS

REVENUE (USD m)...........41.9
GROSS PROFIT (USD m)......4.6
OPERATING INCOME (USD m)..(0.9)
NET INCOME (USD m)........(1.5)
Personal Stake: No position.
What the market thinks right now (Bulls vs Bears)
Market: “AI infrastructure picks-and-shovels, but tiny and weird.”
Bull: “Multi-year agreement + expanded facility = visible ramp.”
Bear: “99% customer concentration + fixed-cost buildout = one mistake away from pain.”
This review is about whether the new facility economics and the one-customer model can coexist without turning the income statement into a jump-scare.
Atomic Take: The business is scaling, but the risk is concentrated enough to make the upside feel… conditional.
What breaks this? If the primary customer relationship meaningfully weakens (revenue concentration dropping because revenue drops, not because customers diversify).
Balance Sheet (The Geiger Test)
The balance sheet looks “clean” at first glance because cash is chunky and equity jumped.
As of Sep 30, 2025, cash and equivalents were $70.7m (plus $5.0m restricted cash).
But the buildout didn’t happen with vibes. They drew a bank term loan facility (plus accordion) and ended up with a fully amortizing structure starting mid-2025.
Also: lease liabilities are real gravity. This is a leased facility with large leasehold improvements sitting on top of it.
Nothing here is “bad.” It’s just not optional.
[TSSI][REPORTED (GAAP)][AS OF 30 SEP 2025] KEY STATS

CASH & EQUIV (USD m)........70.7
RESTRICTED CASH (USD m).....5.0
TOTAL DEBT (USD m)..........23.9
LEASE LIABILITIES (USD m)...17.5
TOTAL EQUITY (USD m)........63.4
The Audit:
Optical illusion #1 — “Cash-rich” includes $5.0m posted as collateral against bank debt.
Optical illusion #2 — leasehold improvements are huge ($35.1m), but the underlying building is leased.
Atomic Take: Balance sheet strength exists, but it’s already committed to a capacity bet.
What breaks this? Any sign they can’t cover facility + debt service from the contract economics (watch operating losses plus rising fixed facility charges).
Cash Flow (Energy Output)
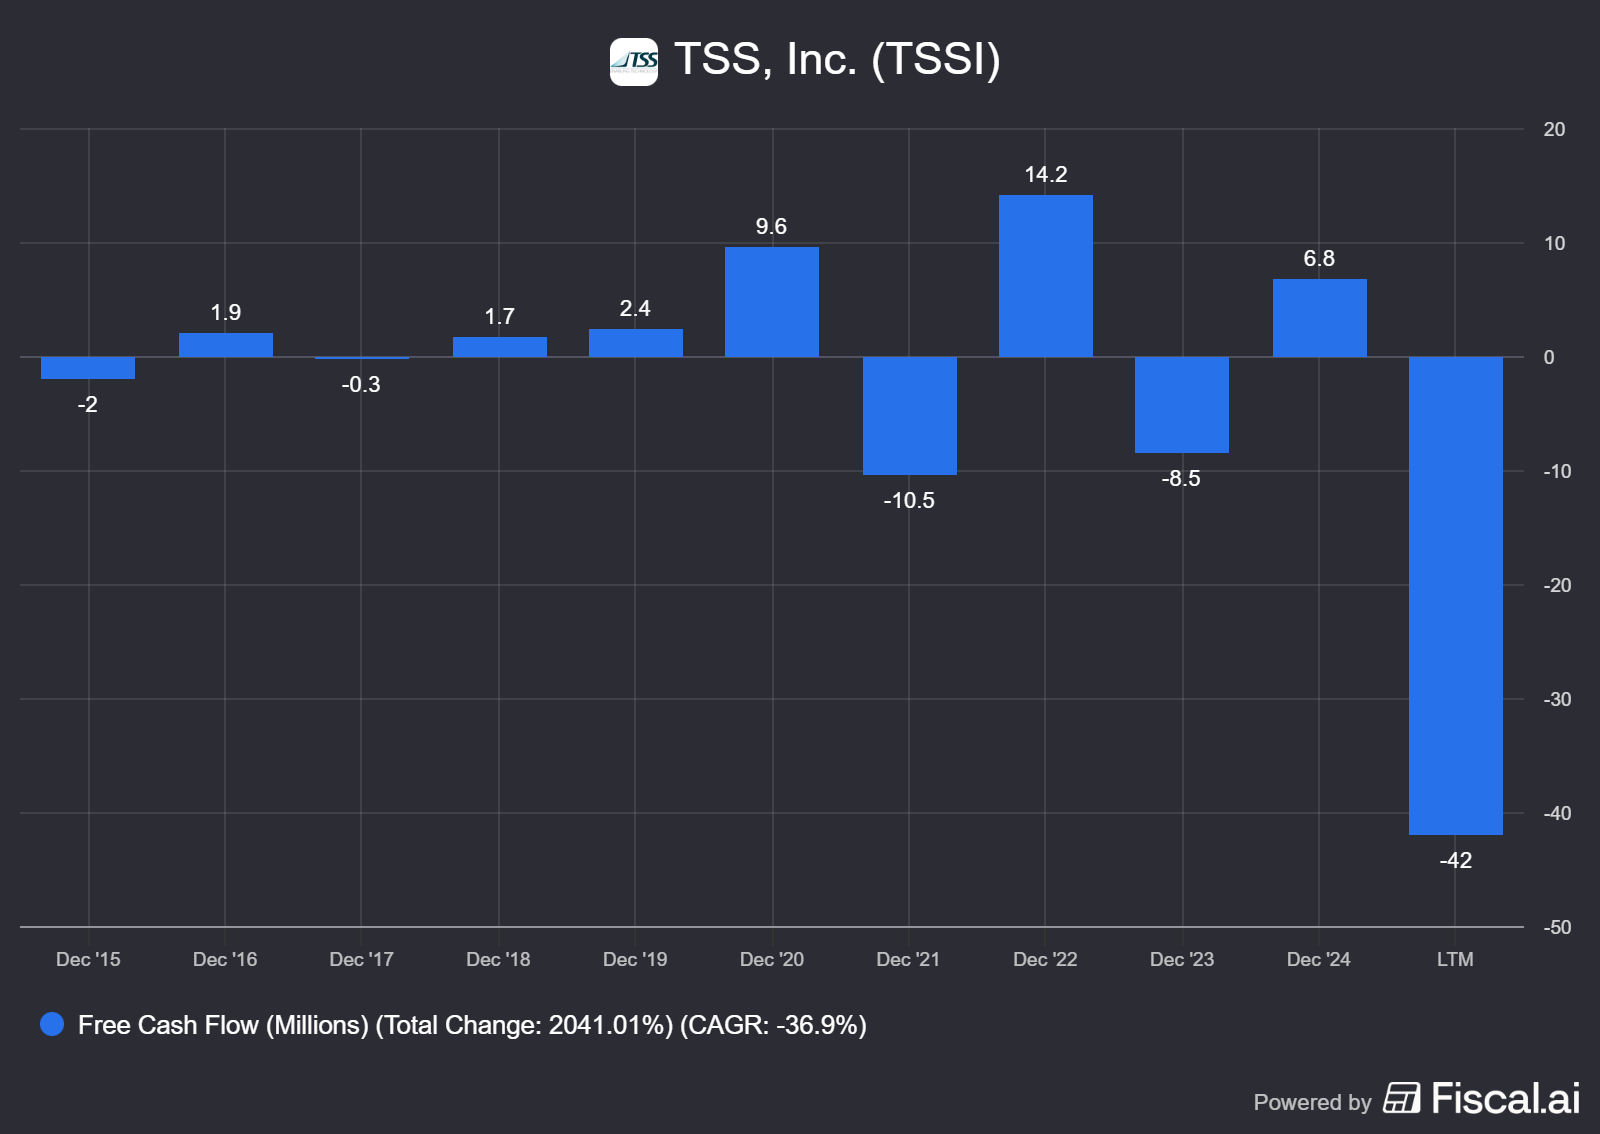
Nine-month cash from operations was $18.5m, which is respectable.
But the company also spent $32.2m on property and equipment in the same period—mostly the new facility buildout.
So the “sustainable cash proxy” flips negative in 2025 YTD, even before you start arguing about what “maintenance capex” should be for a newly-built operation.
Some of the operating cash story is working-capital timing: they explicitly call out procurement timing and trade creditors as a primary financing tool for procurement flow.
The vibe: profitable projects, cash-hungry platform build.
[TSSI][REPORTED (GAAP)][9M 2025] KEY STATS

CASH FROM OPS (USD m)........18.5
CAPEX (USD m)................32.2
CASH AFTER INVESTMENTS (USD m).(13.7) (CFO 18.5 - CAPEX 32.2)
NET CASH FROM FINANCING (USD m).66.2
The Audit: The procurement engine “finances itself” until it doesn’t—quarter-end timing can swing payables/receivables hard.
Atomic Take: Cash generation is currently being outpaced by the buildout, and that’s only fine if utilization ramps.
What breaks this?: If capex stays elevated while cash from ops stalls (watch for another big capex year without matching revenue/segment gross profit lift).
Share Capital & Insiders (Nucleus Check)
The capital structure changed meaningfully in 2025.
In August 2025, they issued 3,450,000 shares and netted $55.3m after transaction costs.
There’s also ongoing stock-based comp expense ($2.9m non-cash for 9M 2025).
Share repurchases in the quarter were not open-market buybacks; they were mainly employee net-settlement/tax withholding mechanics.
And yes, we do have insider activity in the provided materials: Peter H. Woodward reported sales of 30,000 shares (Dec 9, 2025) and 21,700 shares (Dec 11, 2025), via an entity, with weighted-average prices shown on the form.
This section is where the “tiny company” reality shows up.
[TSSI][REPORTED (GAAP)][AS OF 30 SEP 2025] KEY STATS

SHARES OUTSTANDING (m).......27.6
TREASURY SHARES (m)..........2.0
TOTAL EQUITY (USD m).........63.4
[TSSI][REPORTED (GAAP)][9M 2025] KEY STATS
SHARES ISSUED (m)............3.45
EQUITY PROCEEDS, NET (USD m)..55.3
STOCK COMP (USD m)...........2.9 (NON-CASH EXPENSE)Insider activity: Woodward reported sales on Dec 9 and Dec 11, 2025.
Atomic Take: The equity raise bought runway, but it also raised the bar—now the facility has to earn its keep.
What breaks this? More large equity issuance before the new footprint shows durable operating profitability.
Income Statement (Reaction Chamber)
Here’s the core confusion with TSSI: revenue can lie to your face without actually lying.
Procurement can be booked on a “net deal” basis (they record just the fee as revenue) or a “gross deal” basis (they record the gross value and allocate revenue/cost between procurement and systems integration).
That means reported procurement revenue can swing wildly even when underlying economics are “relatively similar,” per the company.
In Q3 2025, revenue fell because procurement had an unusually large prior-year comparison, while systems integration grew on AI rack activity and increased fixed monthly fees tied to the Georgetown facility going fully operational.
Margins got squeezed in 2025 YTD: consolidated gross margin moved from 15% to 12% (YTD), with systems integration margin pressured by depreciation and certain “uncapitalizable” facility-readying costs.
Depreciation is now a character in the plot.
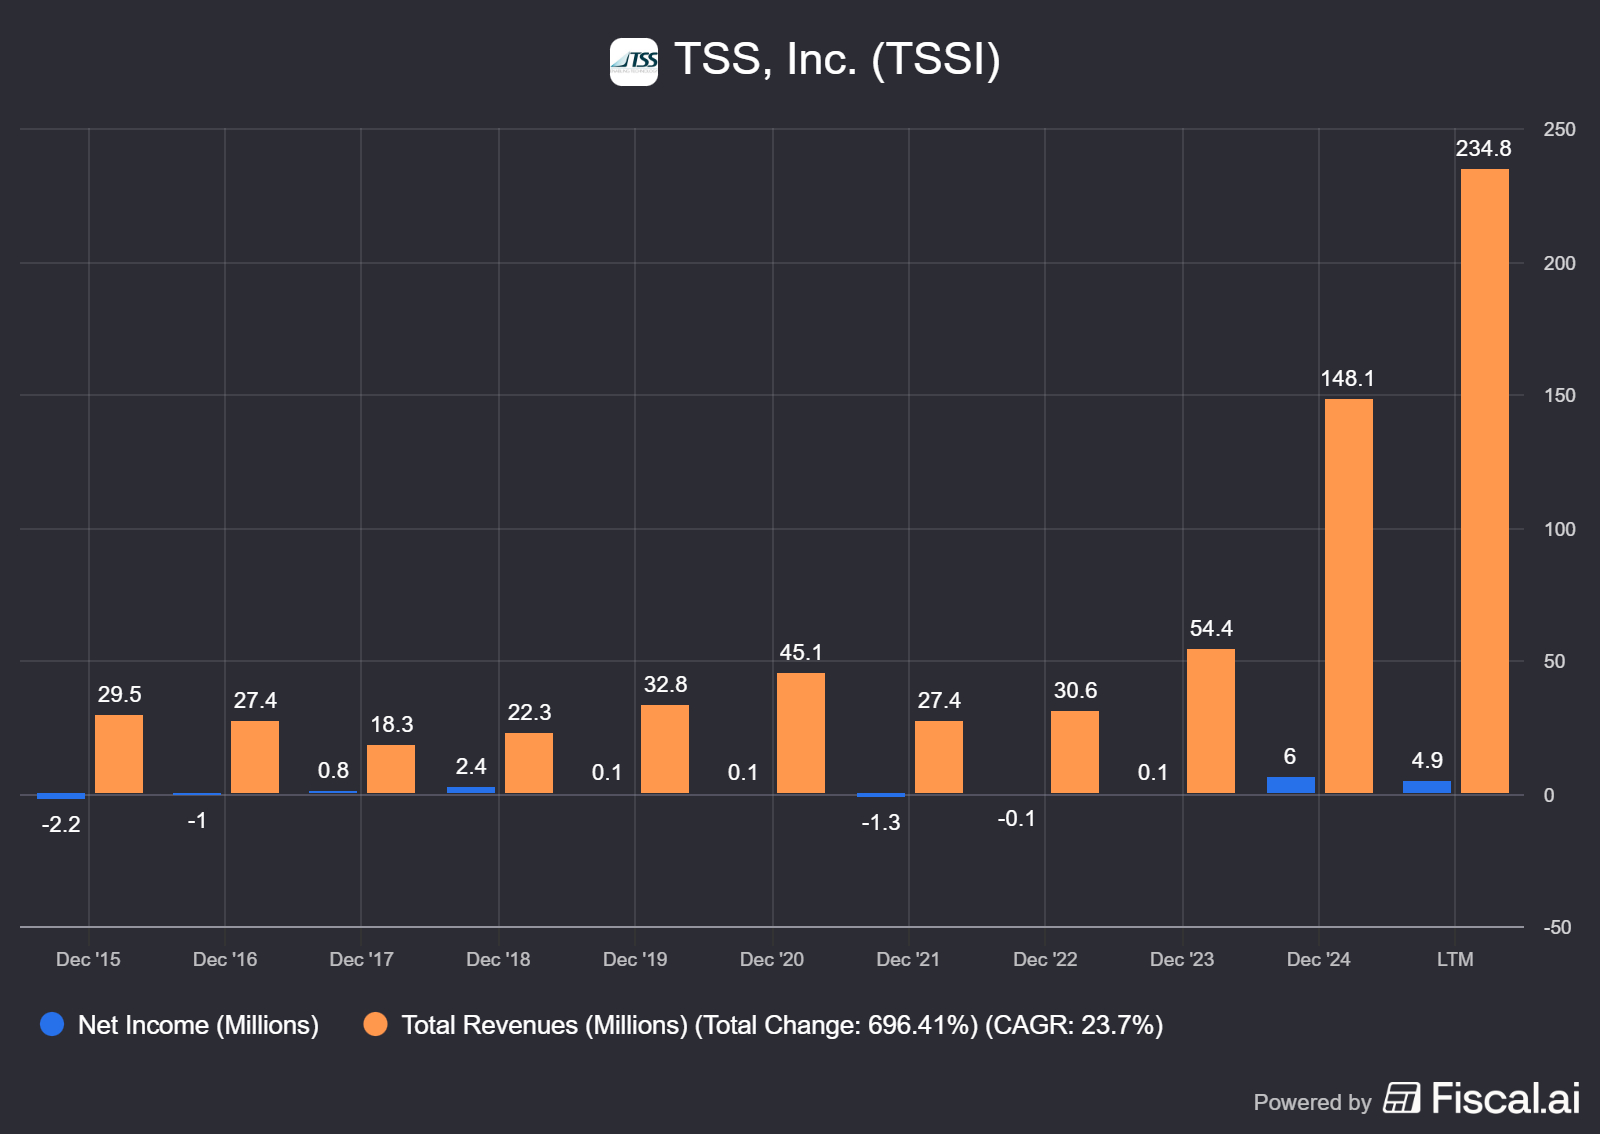
[TSSI][REPORTED (GAAP)][9M 2025] KEY STATS

REVENUE (USD m).............184.8
GROSS PROFIT (USD m)........21.0
OPERATING INCOME (USD m)....5.4
NET INCOME (USD m)..........3.0This is the scorecard. Each card separates what’s true today from what could happen next, then names the one signal that will prove it either way.
Signal 1: One-customer gravity
🔒 FACT: One US-based IT OEM represented 99% of revenue and 99% of accounts receivable as of 30 Sep 2025.
🧠 HYPOTHESIS: The multi-year agreement and “base case for volume” reduce the risk of a sudden revenue air-pocket.
📈 MONITOR: Customer concentration staying near-total, plus any disclosure of reduced minimum volume commitments (termination-for-convenience mechanics).
Signal 2: Factoring as a hidden toll
🔒 FACT: They use non-recourse factoring for receivables from that customer; $259.4m gross amount factored in 9M 2025 with $3.3m fees recorded as interest expense (or deferred).
🧠 HYPOTHESIS: Factoring stays a “cheaper-than-borrowing” working-capital tool, not a margin leak.
📈 MONITOR: Factoring fees versus segment gross profit trend, and whether gross factored volume keeps running ahead of reported revenue due to netting.
Signal 3: Fixed power costs vs utilization
🔒 FACT: Fixed facility power charges were about $231k/month (plus usage) and are scheduled to rise to $289k/month as power availability increased to 15MW.
🧠 HYPOTHESIS: Utilization ramps fast enough that fixed power costs get diluted by higher rack volume, starting as early as Q4 2025 (company expectation).
📈 MONITOR: Systems integration segment gross margin and pre-tax income trend, since that segment bears most facility costs (including the old Round Rock site until subleased/redeployed).
Atomic Take: TSSI’s reported revenue is real, but it’s also highly “accounting-shapeable” because mix and netting matter.
What breaks this? If systems integration can’t produce consistent segment profitability once the new facility is “fully operational,” despite the fixed-fee structure.
The Atomic Verdict
• Quality: Strong operational relevance (AI rack integration + procurement + services), but highly dependent on execution and accounting mix.
• Health: Liquidity is real ($70.7m cash), but fixed obligations (debt + leases + power) are now baked in.
• Overhang: One-customer concentration plus an internal control material weakness that management says is not fully remediated.
• What must happen next: Utilization must climb so systems integration absorbs depreciation/power/dual-facility costs without recurring quarterly losses.
Status: Overhang-Heavy — RADIOACTIVE
Stars: ★★☆☆☆
Reason 1: Customer concentration is effectively total.
Reason 2: The cost base just became meaningfully fixed.
Upgrade Triggers
• Systems integration shows sustained margin improvement as facility costs dilute (watch segment gross margin and segment pre-tax income trends).
• Evidence of customer diversification (revenue concentration falling because new customers grow).
• Formal remediation/validation progress on the material weakness (controls become effective).
Downgrade Triggers
• Any signal of weakening minimums/volume commitments, or customer termination risk becoming less theoretical.
• Fixed power/occupancy costs rise faster than utilization (power fee step-up without revenue response).
• Capex stays elevated without matching operating cash and profit traction.
TSS builds the physical racks for AI, but they aren't the only 'Pick and Shovel' play. Innodata (INOD) performs the digital equivalent—cleaning the data that feeds these massive models
Disclaimer
The content within Atomic Moat Research is designed to be a “bolt-on” intelligence layer to your own due diligence, not a replacement for it. I conduct these deep dives to decode financial statements and valuation models for the rational retail investor.
Independence: I do not accept compensation of any kind from the companies I review. My research is driven solely by my personal search for high-quality compounders.
Skin in the Game: Unless otherwise stated, assume the author holds long positions in the assets discussed. I invest my own real capital alongside my analysis. This creates a bias you should be aware of. While I strive for institutional-grade depth based on the most recent filings, my opinions are my own. I am not a financial advisor. All readers are encouraged to perform their own due diligence prior to deploying capital.