

The Complete Guide to Scale Economies Shared Investing
How Nick Sleep’s most powerful idea works, where it came from, and the one ratio that tells you whether the moat is real.

What this guide covers
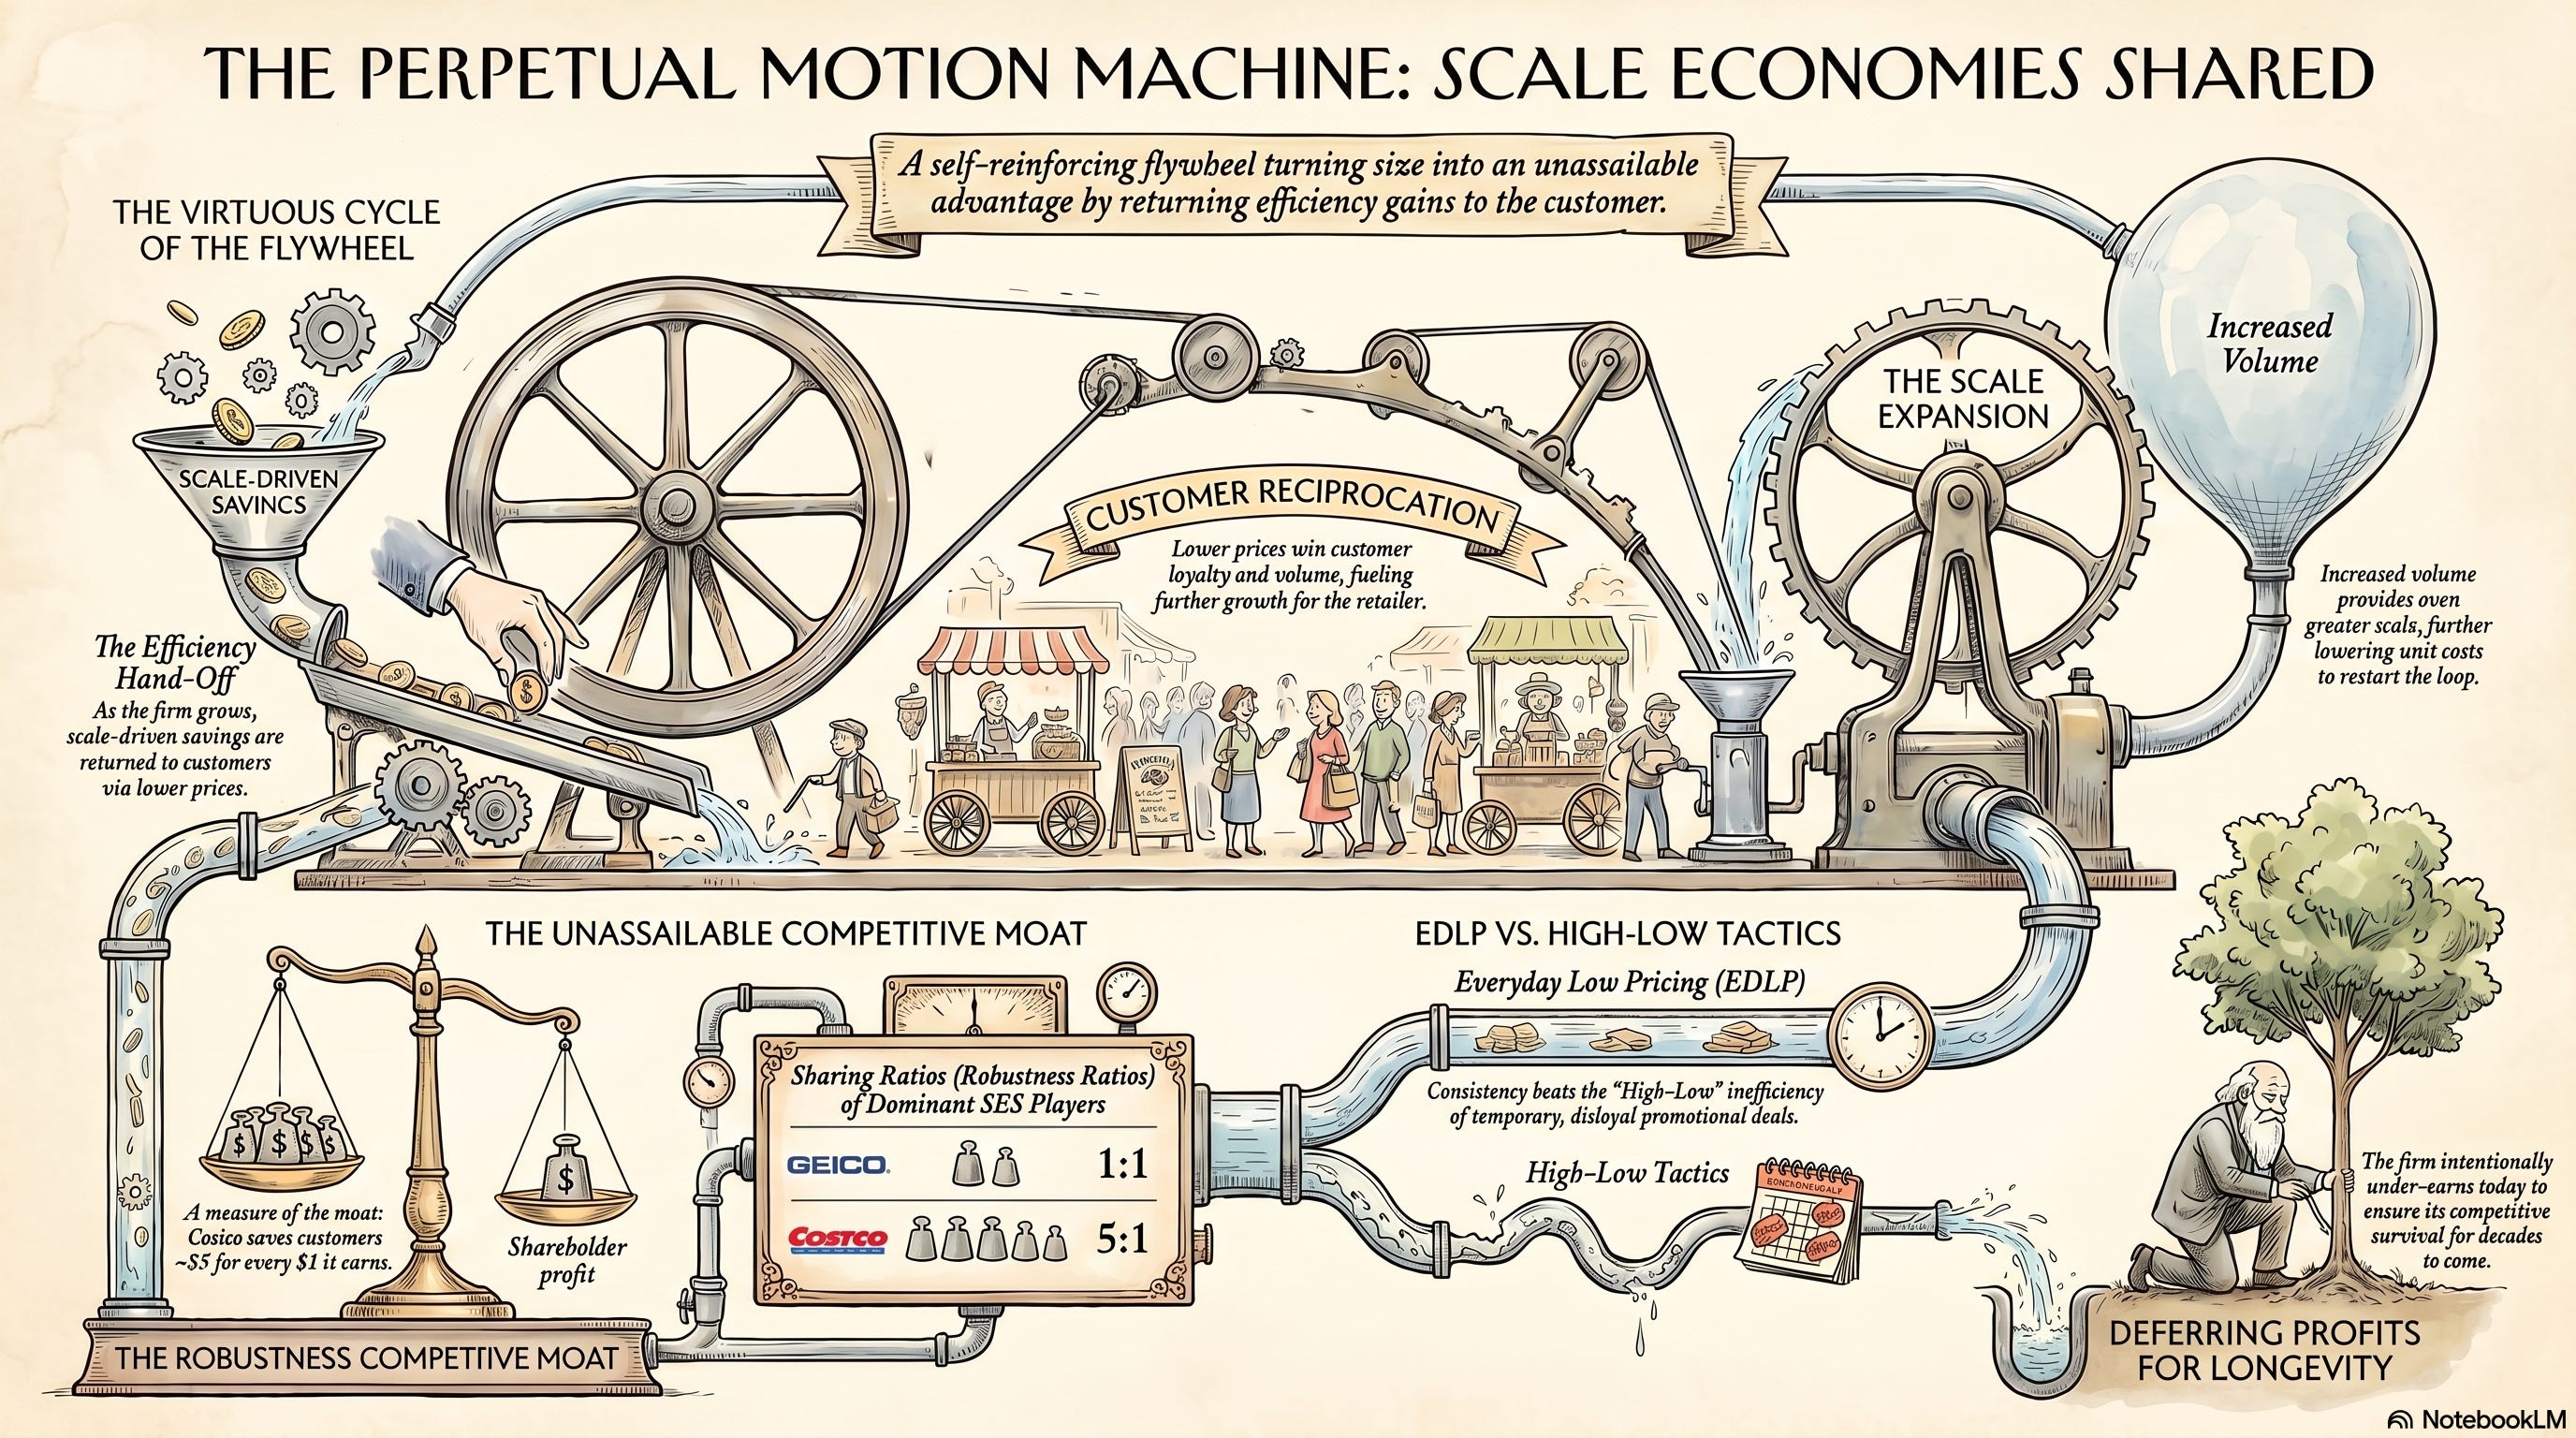
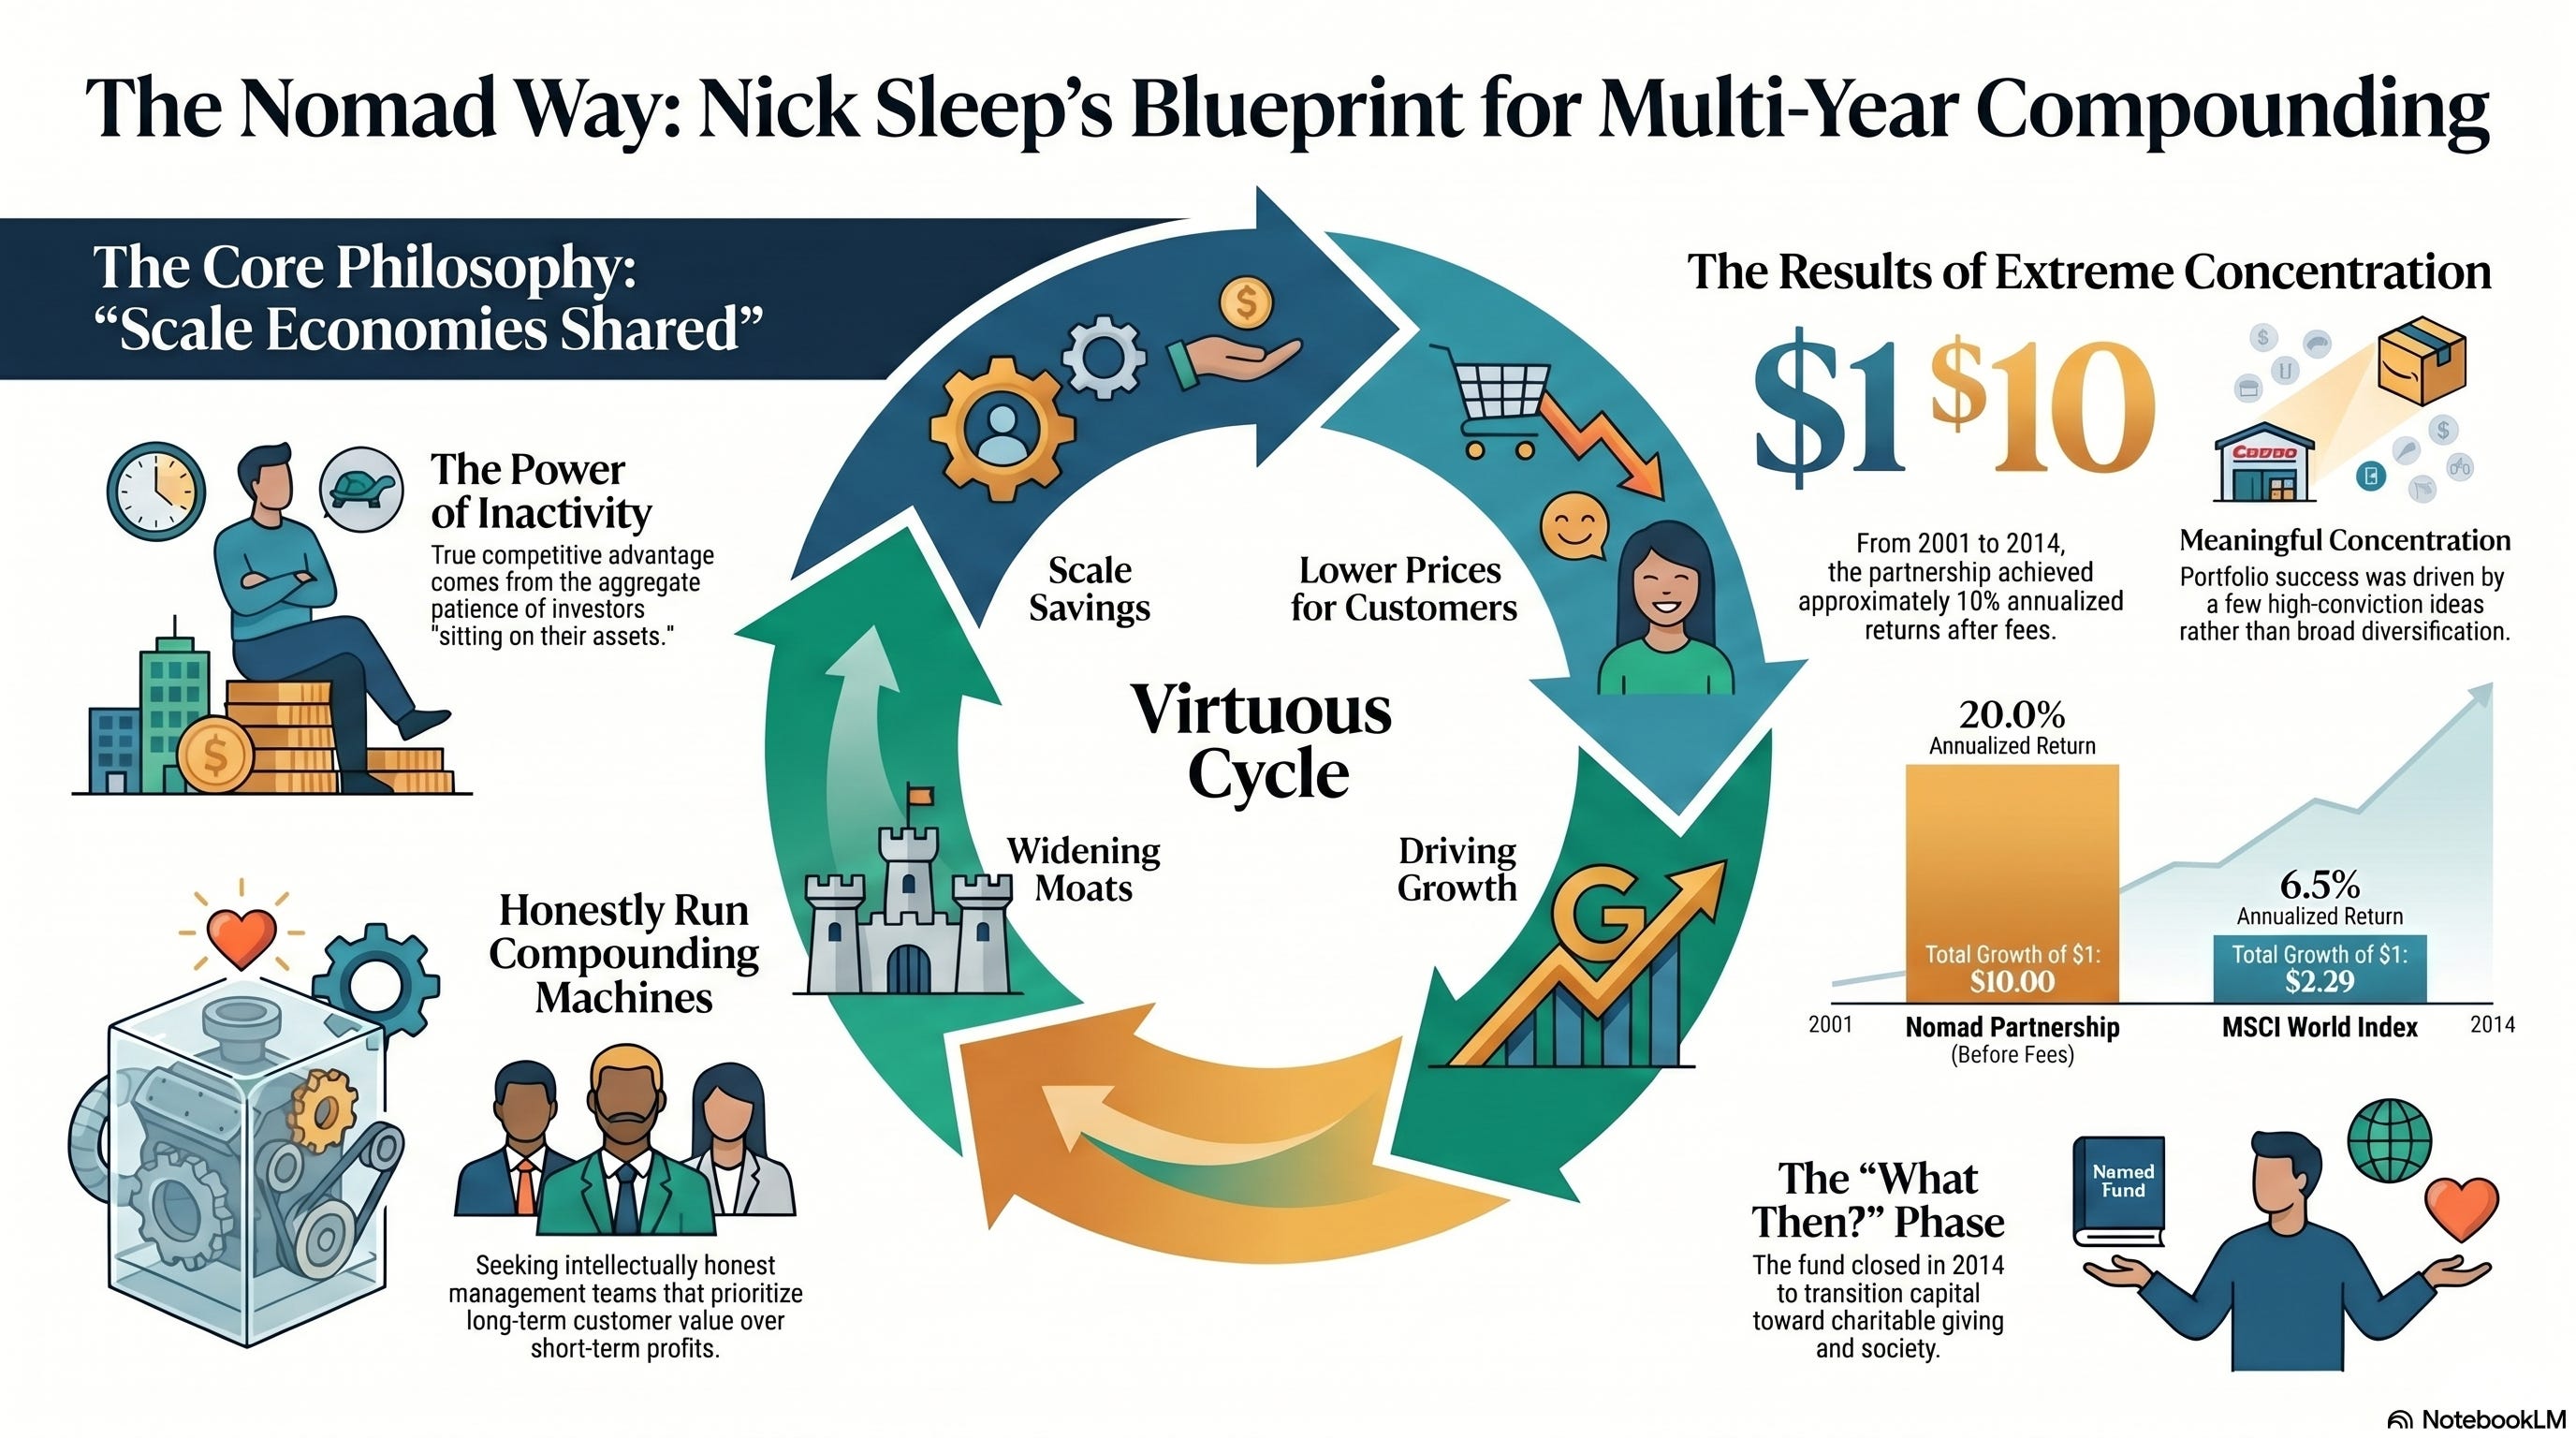
Scale economies shared is the most powerful business model in long-term investing. The idea is simple. A company earns a cost advantage as it grows. Instead of keeping that advantage as fat margin, it deliberately hands most of it back to the customer as lower prices, better service, or wider selection. The customer notices, and rewards the company with more business. That extra volume creates more scale, which creates a bigger cost advantage, which gets handed back again. The loop turns on itself, and it gets harder to attack every year it runs.
Most moats defend a position. This one widens it. That is the whole reason it sits at the top of the durability ranking.
This guide does three things.
It traces the origin of the idea: Nick Sleep and the Nomad Investment Partnership.
It explains how the flywheel actually works, step by step, with the original examples.
It shows you how to measure the strength of the moat using the robustness ratio, the tool Sleep built for exactly this job, including the caveats he attached to it that almost everyone leaves out.
(At the bottom are links to three full deep dives on live examples of the model: Nu Holdings, MercadoLibre, and Toast.)
One note on the name before we start. Sleep used both “scale economics shared” and “scale economies shared” in his letters. They mean the same thing, and this guide treats them as interchangeable.
Where did the idea come from?
The phrase belongs to Nick Sleep, but the lineage runs deeper than one man.
Sleep (born in the UK in 1968) studied geography, not finance. He worked as a landscape architect, in department stores, at an IT firm, and as a sponsored windsurfer before joining Sun Life of Canada as an analyst and then moving to Marathon Asset Management in London in 1995.
His partner, Qais “Zak” Zakaria (born in Iraq in 1969), came from Deutsche Bank, where he covered Asian equities. The two met in their late twenties.
Marathon is the part of the story people forget. It was a London shop built around the capital cycle, the discipline of watching where capital floods in (and returns collapse) and where capital starves (and returns recover). Sleep’s mentor there was Jeremy Hosking, one of Marathon’s co-founders. The intellectual habit Sleep absorbed was to study the structural mechanics of an industry rather than guess next quarter’s earnings.
The robustness ratio first appeared in a Marathon Global Investment Review before it was carried into the Nomad letters.
In September 2001, Sleep and Zakaria launched the Nomad Investment Partnership under the Marathon umbrella. It began investing on the 10th, one day before the 11th. They spun it out as an independent partnership in 2006 and closed it voluntarily in 2014 to focus on philanthropy.
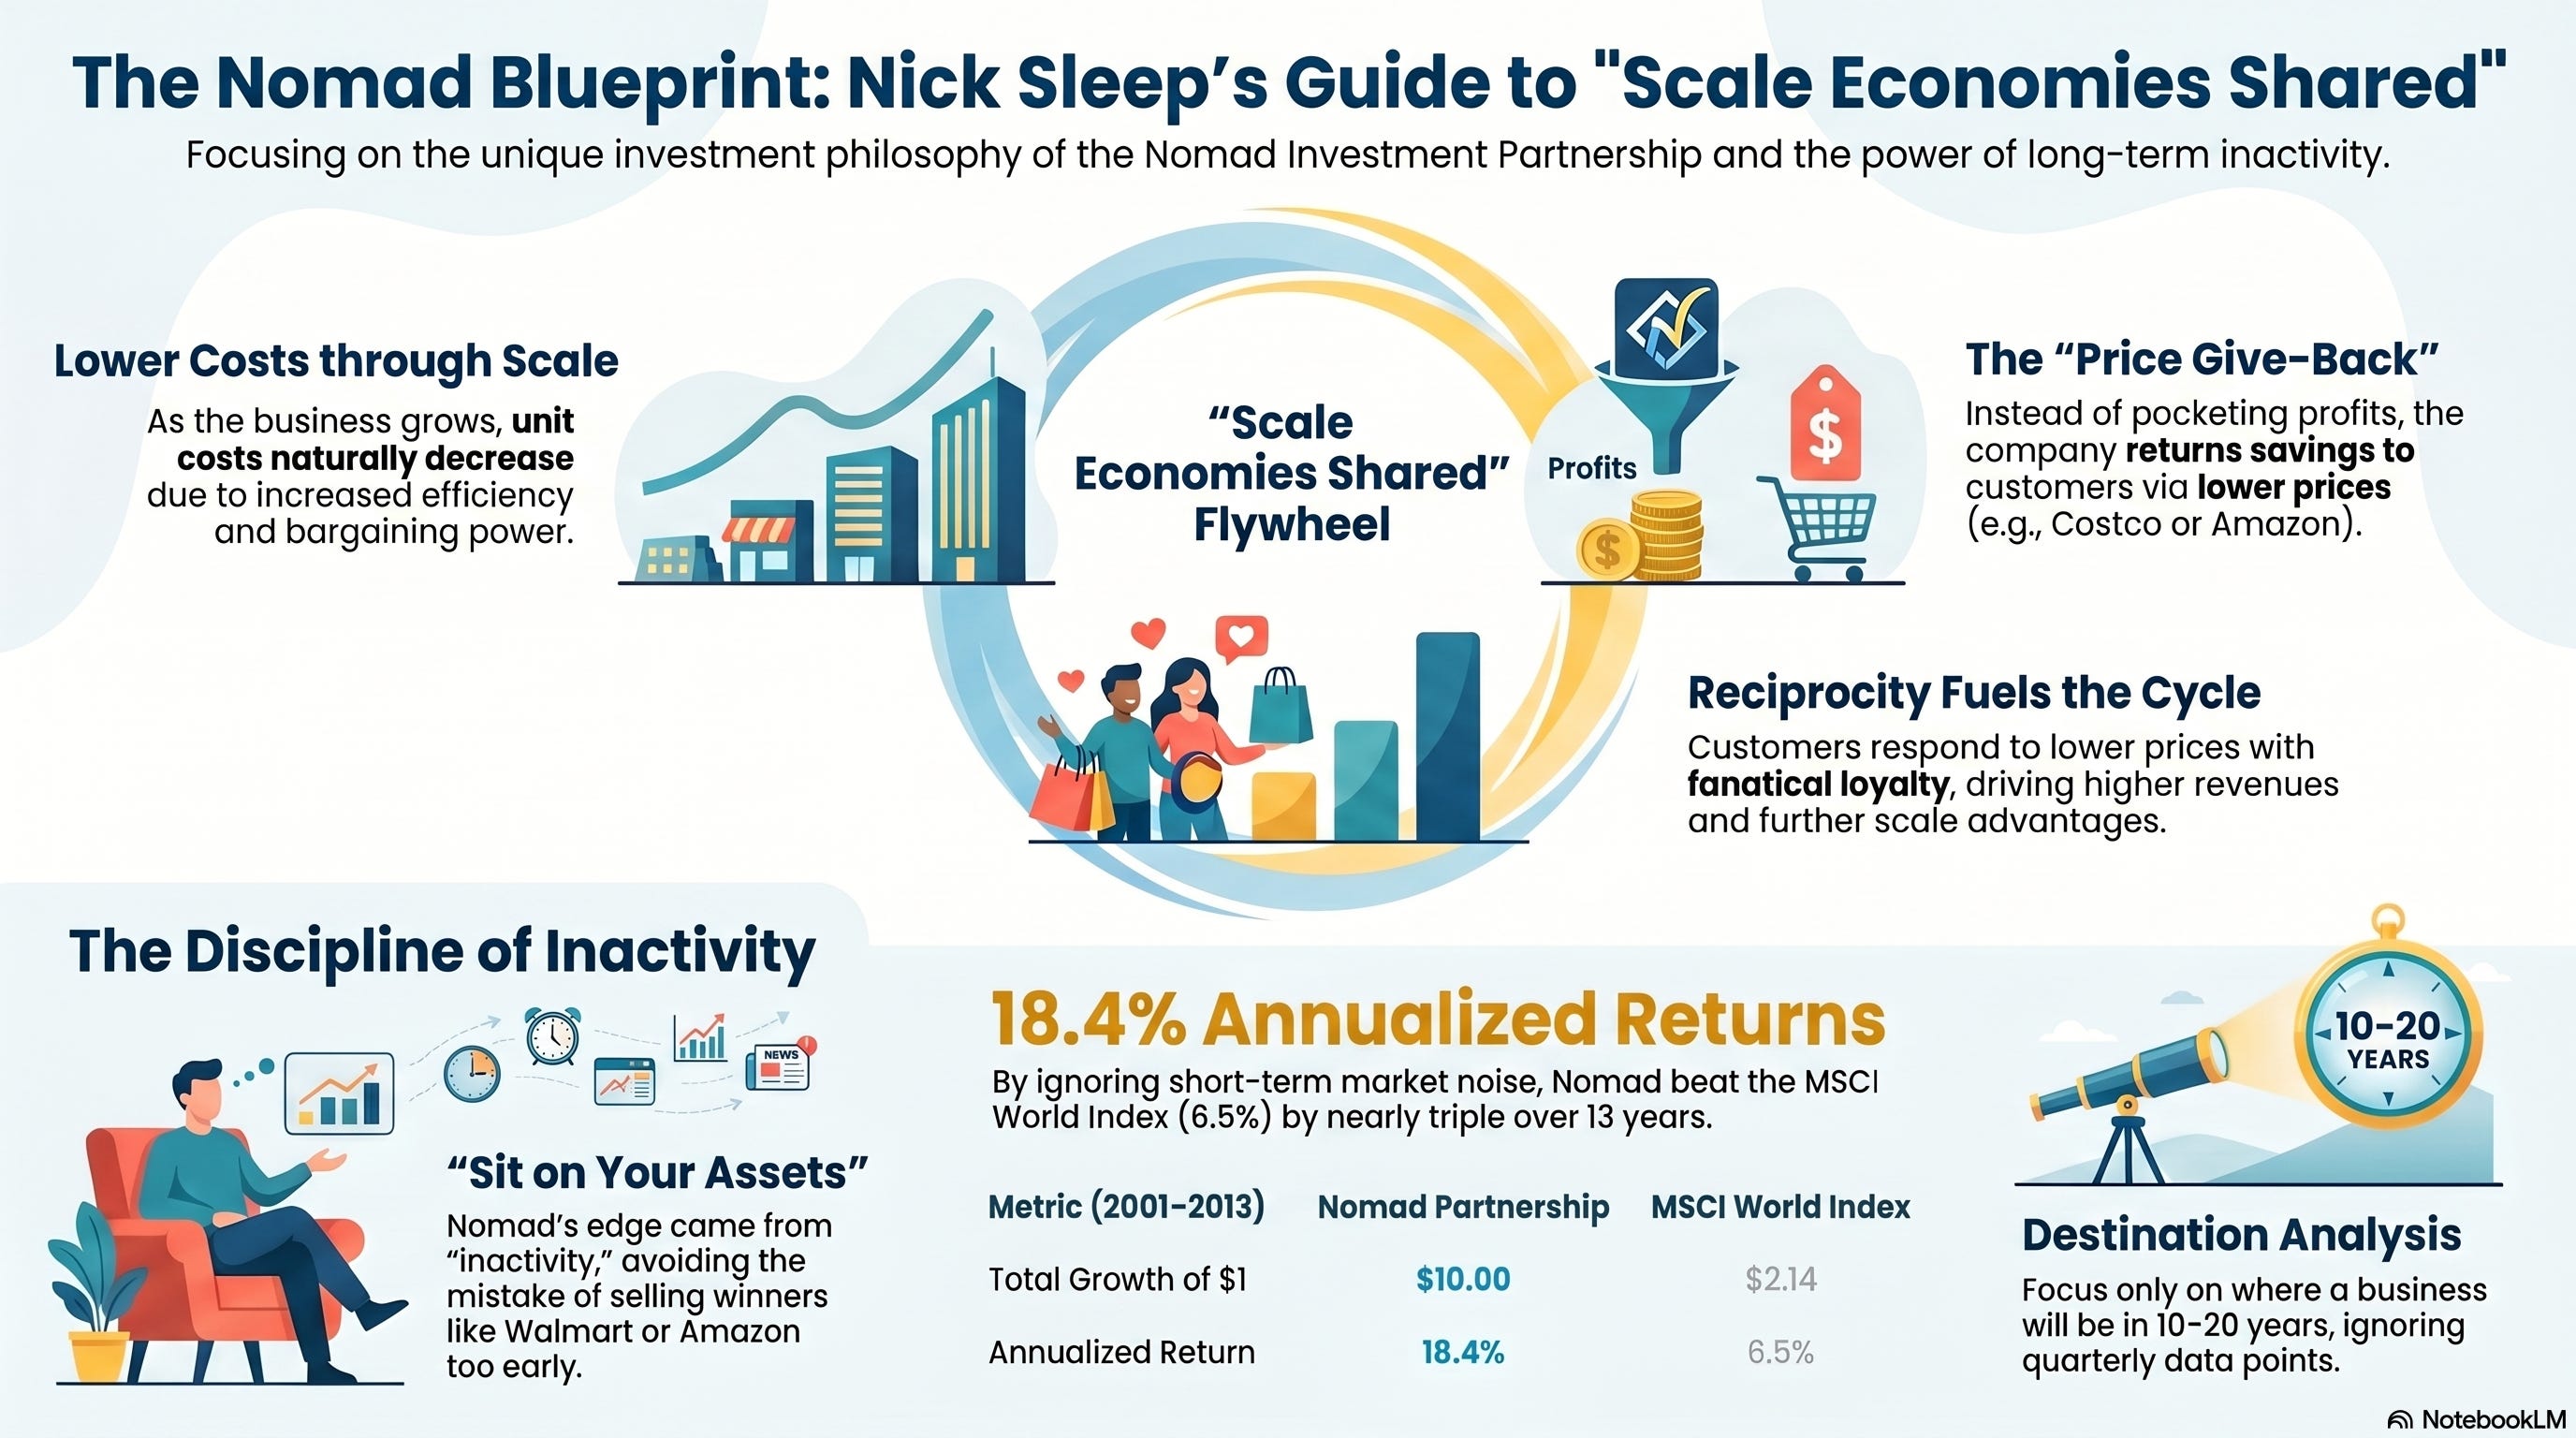
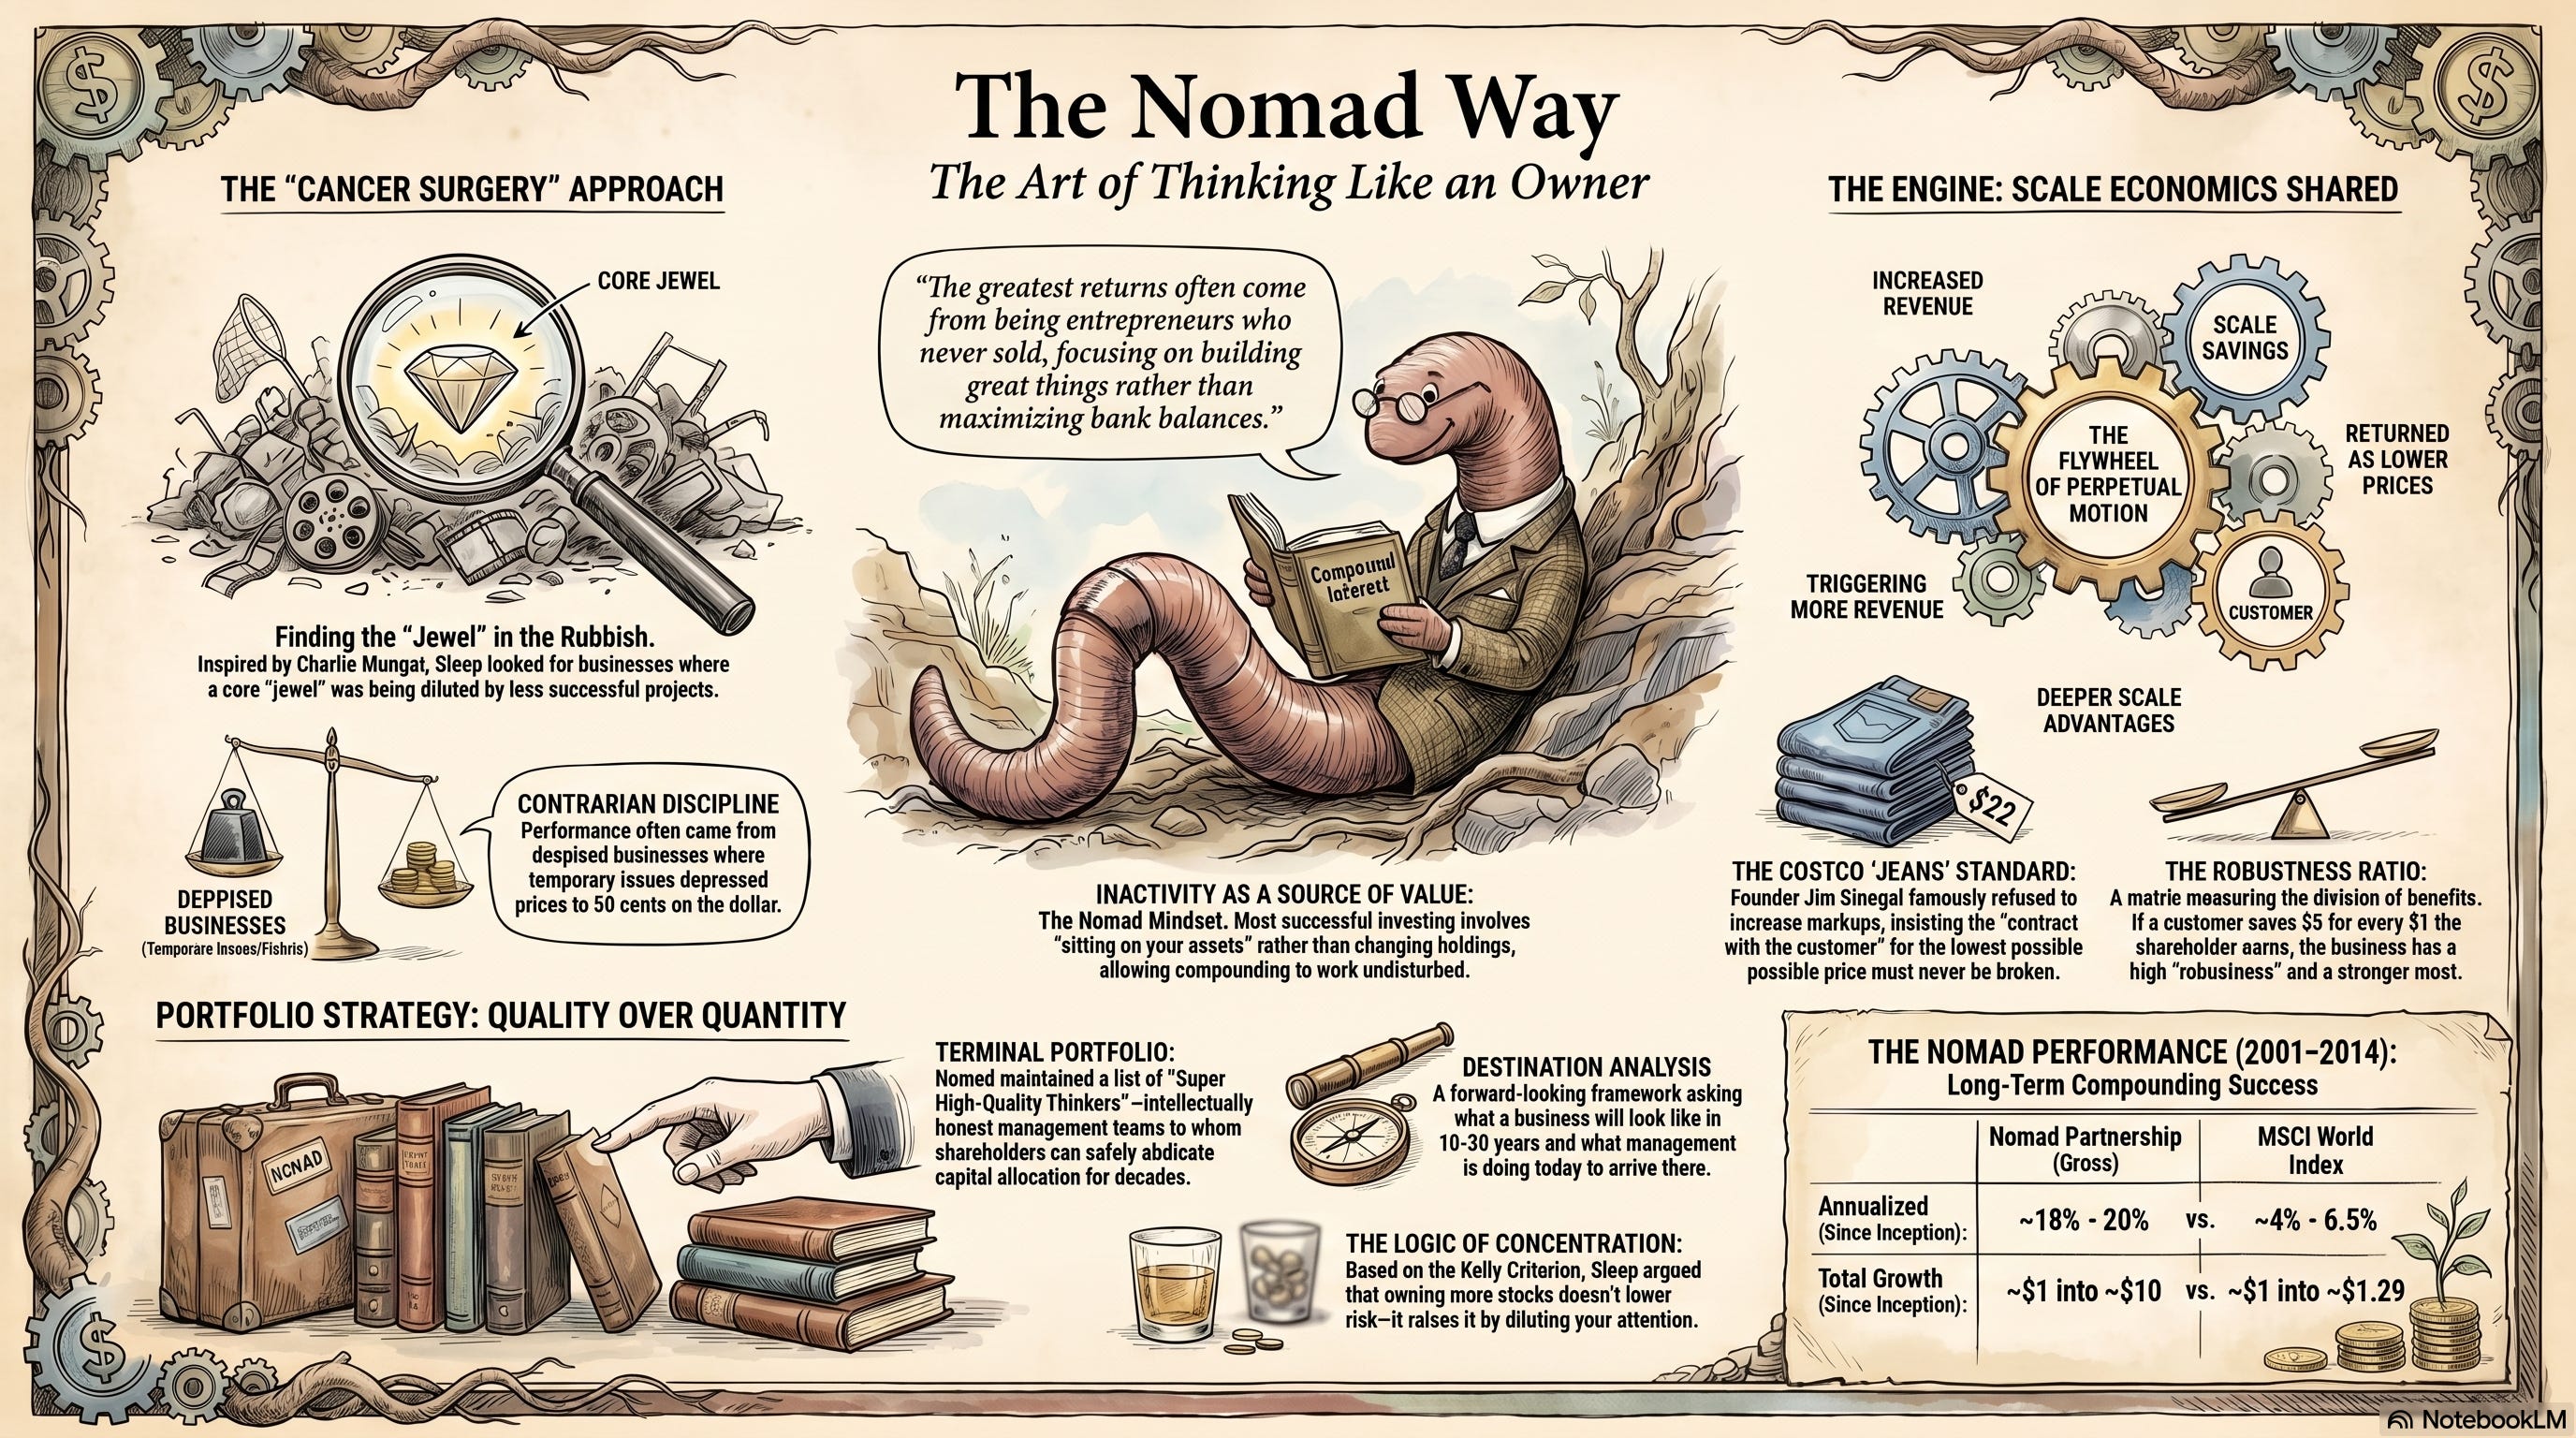
The numbers are the reason anyone studies them. Over roughly thirteen years, Nomad compounded at about 20.8 percent a year before fees, against about 6.5 percent for the MSCI World Index over the same stretch. One dollar became roughly ten. They did it with almost no turnover, a handful of names, no leverage, and letters typed in Courier font that they mailed to partners a couple of times a year. By the end the portfolio was concentrated in a short list led by Costco, Amazon, and Berkshire Hathaway.
Do you want a copy of the full Nomad Partnership letters? Get them here.
The seed of the whole framework was a single observation in Warren Buffett’s 2004 Berkshire letter about GEICO. Buffett pointed out that GEICO delivered real money to three groups at once. Customers saved roughly a billion dollars compared to what they would have paid elsewhere. Employees earned a large profit-sharing bonus. Owners earned an excellent return. Those benefits existed only because of scale. Sleep read that and asked a sharper question. If scale produces a pool of benefits, who gets it, and what does the split tell you about how hard the business is to attack?
That question became the robustness ratio, and the company that answered it most beautifully was Costco. Nomad made Costco its largest holding and never stopped writing about it.
The mechanics of the flywheel
Here is the loop in plain terms, using a low-price retailer like Costco as the model.
The business buys in enormous volume, so it buys cheaply. It runs a lean operation, so its costs per dollar of sales are low.
Now it has a choice:
It can pocket the savings as a higher margin, or it can drop its prices.
Costco drops its prices. The customer gets goods cheaper than anywhere else, so the customer comes back and buys more. More sales means more volume, which means even better buying power and even lower costs per unit, which Costco hands back again as still lower prices. Round and round.
Sleep contrasted this with the ordinary “high-low” supermarket, and the contrast is the whole point. The high-low retailer runs an inefficient operation, charges high everyday prices to cover it, then slashes a few items on promotion to pull people through the door, hoping they buy full-price goods while inside. That trains the customer to wait for deals, shop around, and stay disloyal. It also forces the retailer to constantly reprice, and it makes volumes lumpy and unpredictable. The incentives in that system reward exactly the behaviour that hurts the business.
The scale economies shared system rewards the opposite. The customer is trained to trust the price every day and to consolidate spending with the one player who is always the cheapest. Sleep called customer reciprocation a super-factor in business performance, and he meant it literally. It is the engine that makes the loop spin.
Three things follow from this, and each one matters for an investor.
It works far beyond retail.
Sleep pointed to AirAsia, the low-cost Malaysian carrier, whose planes flew fuller than the high-fare flag carriers because low fares filled seats. He pointed to Amazon, whose total cost per dollar of sales (operating costs plus operating margin) was lower than some high-street rivals’ costs alone. That is a brutal fact. It means those rivals could price at break-even and still not undercut Amazon. The model is industry-agnostic. It shows up anywhere a cost advantage can be returned to customers in a way they will reward.
It lowers the probability of failure every year.
This is the single most important property, and it is what separates this moat from all the others. A patent defends a position until it expires. A brand defends a position until taste shifts. A scale economy shared business does not sit and defend. Every year it operates, it grows, the cost gap widens, prices fall further, the customer proposition improves, and the business becomes harder to dislodge than it was the year before. Sleep borrowed Peter Bernstein’s image of a cone of uncertainty that widens the further out you look. Costco’s obsession with sharing savings narrows that cone. The future becomes more predictable, not less, which is precisely backwards from how most businesses age.
Forget about the quarters. The destination is the question.
Because the model compounds its own advantage, the right question is never “what does this earn in year three.” It is “what does this look like as a mature franchise in fifteen to twenty years, and is that destination secured by the loop itself.” If the loop is genuine and the management is committed to it, the annual numbers are noise on the way to a destination you can describe.
Why it beats every other moat
It helps to place the model against the alternatives. A durable business needs a moat. It does not need the most durable type. But when you are hunting for the rare position you can size large and hold for decades, the type matters, and scale economies shared has properties the others lack.
A statutory or regulatory monopoly is close to permanent, but it is static. It defends a fixed position and rarely grows the pond. A switching-cost moat deepens with use, which is excellent, but it locks in customers you already have rather than continuously attracting new ones on improving terms. A network effect is powerful when the leading position is structural, but network density can plateau. A brand commands pricing power, but it leans on advertising, and pricing power is the opposite instinct to sharing scale. Patents alone are weak, since they expire and get designed around.
Scale economies shared do something none of these do. It converts size from a threat into a weapon. For most businesses, getting big invites competition, bureaucracy, and decay. For this model, getting big is the mechanism that lowers prices, deepens customer loyalty, and raises the wall. Size is the moat.
For an investor with a long horizon, this links straight to compounding. The reason predictability matters is not comfort. It is that a predictable compounder is the only kind you can size to a large weight and then sit through three fifty percent drawdowns to own for twenty-five years. A lottery-ticket business with a huge but uncertain payoff cannot be sized and cannot be held, so you almost never collect it. The scale economies shared business, with its narrowing cone of uncertainty, is exactly the kind you can hold like that. The multiple then falls out of how long the durability lasts. Compound at 20 percent and you have a six-bagger in ten years, a fifteen-bagger in fifteen, and a ninety-five-bagger in twenty-five. The rate is the thing. The multiple is an output.
The robustness ratio: how to measure the moat
This is the part most writing on the subject gets wrong, so it is worth doing carefully.
Sleep wanted a way to put a number on moat strength for businesses that compete on price. The robustness ratio was his answer. It measures how the pool of benefit created by scale is split.
The definition. In its full form, the robustness ratio is the combined distribution to customers and employees (through lower prices, better service, profit sharing, and the like) divided by the distribution to shareholders. In its simpler and more usable form, it is the amount of money customers save divided by the amount shareholders earn. It is, in one line, dollars saved by customers for every dollar kept by owners.
The two anchor cases. Sleep worked out two, and they are the reference points for everything else.
GEICO sits at roughly 1:1. Customers saved about a billion dollars on their policies compared to the next cheapest carrier, and shareholders earned roughly a billion in underwriting profit. One dollar out to customers for one dollar kept.
Costco sits at roughly 5:1. Sleep estimated that a Costco member saves about five dollars compared to shopping the same basket at an ordinary supermarket, for every one dollar Costco keeps. The arithmetic ran through Costco’s gross margin of about 11 percent against roughly 23 to 26 percent at a Walmart or a Kroger, adjusted for the membership fee.
So what does the number tell you?
Broadly, the higher the ratio, the harder the business is to attack on a like-for-like basis. A rival trying to take share from Costco has to find five dollars of customer value that Costco is already giving away before it even reaches Costco’s own thin profit. That is a very deep moat to cross.
How to estimate it for a candidate.
You do not need management to hand you the figure. The method is:
Work out the customer’s effective cost of using the business.
Work out what the same customer would pay at the next-best alternative.
The difference is the customer saving, the numerator.
The shareholder profit attributable to that activity is the denominator.
Divide. Treat the result as a rough order of magnitude, never a precise reading.
Where the ratio applies, and where it does not. This is the boundary Sleep drew explicitly, and it is the most common misuse. The robustness ratio is appropriate only when the customer proposition is built on price. Costco, GEICO, a discount retailer, a low-fee financial product. It is not appropriate for a proposition built on advertising or aspiration. Sleep used the example of Nike trainers. Nobody buys Nike to save money, so measuring a price-based give-back tells you nothing about that moat. If the value a business delivers is mostly status, brand, or experience rather than price, the robustness ratio is the wrong instrument, and you should reach for a different moat test.
The interpretation is not “higher is always better.” There is a real tension built into the number. A higher ratio means a wider moat. It can also mean a less equitable split, where the business is handing customers so much that shareholders take very little. Costco’s 5:1 and GEICO’s 1:1 may be equally effective barriers against competition. A ratio even finer than GEICO’s may be perfectly sufficient to repel competitors in some industries. The ratio tells you how hard the business is to attack. It does not, on its own, tell you it is the better investment.
The caveats Sleep attached, which almost everyone drops. He was emphatic that the ratio is a thinking tool. It is plainly not a numerical magic bullet for measuring moats. Four specific warnings travel with it:
A finer ratio can still be a powerful barrier. The number is not a leaderboard where 5:1 beats 2:1.
A falling ratio is not necessarily a shrinking moat. It can simply mean the moat is no longer being widened as fast as it could be, while remaining perfectly strong.
The ratio is most useful for spotting companies that are under-earning relative to their potential. This is its real power, and we will come back to it.
The split should change for competitive reasons only, never to please the stock market.
Where the ratio earns its keep: spotting the under-earner. Here is the insight that turned the robustness ratio into a money-making tool rather than an academic curiosity. A business with a high ratio is deliberately leaving profit on the table. It is choosing to under-earn today in order to widen the moat and secure a larger, more certain destination tomorrow.
The stock market, which reads reported earnings, sees thin margins and a cheap-looking business, and misprices it. The patient investor who understands the model sees a franchise getting stronger every year while the income statement understates the truth. This is exactly why Costco’s share price went nowhere for years even as the business strengthened, and exactly why that period was an opportunity. The mispricing is the point.
The time dimension. The right split is not fixed for life. Early in a company’s development, it makes sense to reward customers disproportionately, because referrals and repeat business are what build the franchise. As the business matures, the bias can ease, and shareholders can reasonably take a larger slice. Push that too far, though, and the moat drains.
The capital markets will applaud the higher margins right up until growth stalls and the company enters what Sleep called growth purgatory, the place where a highly rated stock falls because investors finally notice that the reported profitability was borrowed from the future. Coca-Cola leaning too hard on its bottlers, Gillette cutting advertising, Home Depot boosting gross margins: these are the cautionary cases of harvesting a moat to feed quarterly earnings.
The harvesting trap is stated as a rule. When you find a scale economies shared business, watch the direction of the split as closely as the level. Margins creeping up while the customer proposition stops improving is the early signal that management has started to harvest the moat. That is the tide going out. It is the thing that ends these stories.
How to use it inside a full analysis
The robustness ratio is one input, not the whole verdict. It answers a single question well: how deep is the moat for a business that competes on price? It does not tell you whether the destination is large, whether the company can reinvest its cash at a high rate, or whether management is honest. Those are separate tests.
In practice, it slots into the moat work alongside three other judgments.
First, the destination. Where is this business going in fifteen to twenty years? Can you describe it in two plain sentences without hedging, and is that destination secured by the loop itself rather than by a battle not yet won?
Second, the reinvestment runway. A high return on capital only compounds wealth if the business can redeploy its earnings at that high return for a long time. The robustness ratio tells you the moat is deep. The runway tells you whether the engine has room to run. A deep moat around a small, full pond is a fine income stream and a poor wealth builder.
Third, the mispricing. The most valuable setups are the ones where the robustness ratio and the income statement disagree. A high ratio that the market reads as “low margin, mediocre business” is the under-earning mispricing Sleep exploited at Costco.
If you can name the specific wrong heuristic the market is using (cyclical when it is structural, low-margin when it is deliberately reinvesting, stagnant when it is compounding), then you have both a quality thesis and a re-rating thesis in the same name. That is the combination that produces the largest long-run returns, where the growth does the heavy lifting and a multiple re-rating adds a kicker on top as the business proves its durability.
Price still comes last, and it still binds. A wonderful flywheel at a silly price is a watch-and-wait, not a buy. But for a genuinely secured, widening, scale economies shared business, the protection lies in the durability and predictability of the compounding, and demanding a deep bargain entry often just means never owning it at all.
The model in the wild: three deep dives
The clearest way to learn the model is to watch it operate in real businesses. Below are three live examples, each with a full deep dive. They are deliberately different. One is a near-perfect modern copy of GEICO. One is the textbook marketplace-plus-fintech flywheel. One is the honest edge case where the robustness ratio is harder to apply, which is itself the lesson.
Nu Holdings: the modern GEICO of financial services
If you want to see the robustness ratio in its purest modern form, look at Nubank. It built a digital-only bank with a cost to serve a fraction of what Brazil’s incumbent giants carry, and it handed that advantage straight back to customers as free or near-free products in a market long defined by high fees.
Customers reciprocated, mostly through word of mouth, which kept customer acquisition costs low and fed the loop. More customers mean more scale and more data, which lowers the cost to serve and sharpens credit underwriting, which funds an even better customer deal. The give-back is measured in fees the customer no longer pays, which is exactly the kind of price-based proposition the robustness ratio was built to measure. Nubank is the closest thing in this generation to the GEICO that started the whole framework.
Read the full Nu Holdings deep dive →
MercadoLibre: the Latin American flywheel

MercadoLibre runs two reinforcing flywheels at once. The marketplace loop is the classic version: more buyers attract more sellers, which widens selection and pushes prices down, which attracts more buyers. The scale economies shared mechanism shows up most clearly in logistics, where building out fulfilment lowers the per-parcel cost of delivery, which gets handed to buyers as faster and cheaper shipping.
Bolted to that is Mercado Pago, the payments and fintech arm, where rising volume lowers the effective cost of moving money and funds better products. This is a marketplace-plus-fintech compounder, not a passive listings portal, and the distinction is the whole point. The give-back runs through cost, selection, and convenience rather than a simple shelf price, which makes the robustness ratio a directional read here rather than a clean single figure.
Read the full MercadoLibre deep dive →
Toast: where the robustness ratio gets harder

Toast is the most instructive of the three precisely because it does not fit the Costco template cleanly. It is the operating system for restaurants, bundling point-of-sale software, online ordering, payroll, and payments into one platform. The scale loop is real. As Toast grows, it spreads its software investment across more restaurants and processes more payment volume, which lets it offer an ever more capable platform at a competitive, effective cost.
But the benefit it hands back is mostly capability and integration, not a lower headline price. That puts it nearer the boundary Sleep drew, where the proposition is partly about value delivered rather than purely about price saved. The honest read is that Toast blends scale economics with switching costs, and that the robustness ratio is harder to compute for it than for a pure discounter. That is the lesson: the model is a spectrum, and the cleanest measurement belongs to the businesses competing most directly on price.
Read the full Toast deep dive →
Frequently asked questions
Is scale economies shared the same as economies of scale? No. Economies of scale just means costs per unit fall as a business grows. That is common, and on its own it produces a fatter margin that invites competition. Scale economies shared is the deliberate decision to give most of that cost saving back to the customer as lower prices or a better deal, which triggers the reciprocation loop. The sharing is the part that builds the moat.
Does giving savings away just mean lower profits forever? In the short run, yes, margins look thin. That is the point. The business is choosing to under-earn today to secure a larger and more certain destination, and a widening cost advantage means per-share free cash flow can still grow steadily even on flat margins, helped by rising volumes and falling asset intensity. The reported income statement understates the franchise, which is the mispricing the patient investor exploits.
How is the robustness ratio different from gross margin or return on capital? Gross margin and return on capital measure how much the business keeps. The robustness ratio measures how much it gives away relative to what it keeps. A business can have a low gross margin and a very high robustness ratio at the same time, and that combination, low reported profitability sitting on top of an enormous customer give-back, is the signature of a deep and deliberately under-earned moat.
Which companies are scale economies shared businesses? The canonical historical cases are Costco, GEICO, and Amazon. Sleep also pointed to AirAsia. Live modern examples that exhibit the loop include Nu Holdings and MercadoLibre, with Toast as a partial case. The test is whether the business systematically returns its scale advantage to customers in a way that they reward with more business.
Why did Costco’s stock go nowhere for years if the model is so good? Because the market reads reported earnings, a business that deliberately keeps margins thin to widen its moat looks cheap and unexciting on those earnings. The franchise was strengthening the whole time. The gap between the improving business and the flat stock was the opportunity, and it is the clearest real-world illustration of why this model rewards patience.
Can the model break? Yes, in one main way. Management starts to harvest the moat, letting margins creep up to please the stock market while the customer proposition stops improving. The capital markets applaud right up until growth stalls and the stock falls. Watching the direction of the split, not just its level, is how you catch this early.
Key takeaways
Scale economies shared is a business model where a company hands its growing cost advantage back to customers, triggering a self-reinforcing loop that widens the moat every year it runs.
It is the most durable moat type because size becomes a weapon rather than a liability, and because it lowers the probability of failure over time rather than merely defending a fixed position.
The robustness ratio measures the depth of the moat for price-based businesses. It is customer savings divided by shareholder profit. GEICO sits near 1:1 and Costco near 5:1.
The ratio is a thinking tool, not a magic number. A finer ratio can still be a powerful barrier; a falling ratio is not necessarily a shrinking moat, and the instrument only fits propositions built on price.
The ratio’s real power is in identifying businesses that are deliberately under-earning, which the market misprices on reported earnings. That mispricing is the source of return.
The model breaks when management harvests the moat to flatter margins. Watch the direction of the split.
Predictability is what lets you size a position large and hold it through deep drawdowns, which is how the compounding is actually captured.
Sources and further reading
The Nomad Investment Partnership letters to partners, Nick Sleep and Qais Zakaria, 2001 to 2014. The primary source for both scale economies shared and the robustness ratio.
Berkshire Hathaway annual letters, Warren Buffett, in particular the 2004 letter discussing GEICO, which seeded the framework.
Richer, Wiser, Happier, William Green, 2021, chapter six on Sleep and Zakaria.
Capital Returns, edited by Edward Chancellor, for the Marathon capital-cycle thinking that shaped Sleep’s approach.
Internal deep dives: Nu Holdings | MercadoLibre | Toast
Saving this for my afternoon reading session